

Market Valuation
Fairly Valued
Internet Computer
ICP
Bitcoin Cash
BCH
Litecoin
LTC
 Market Valuation
 Consensus
 Best For
How This Company Makes Money
Dividend Analysis ACIV
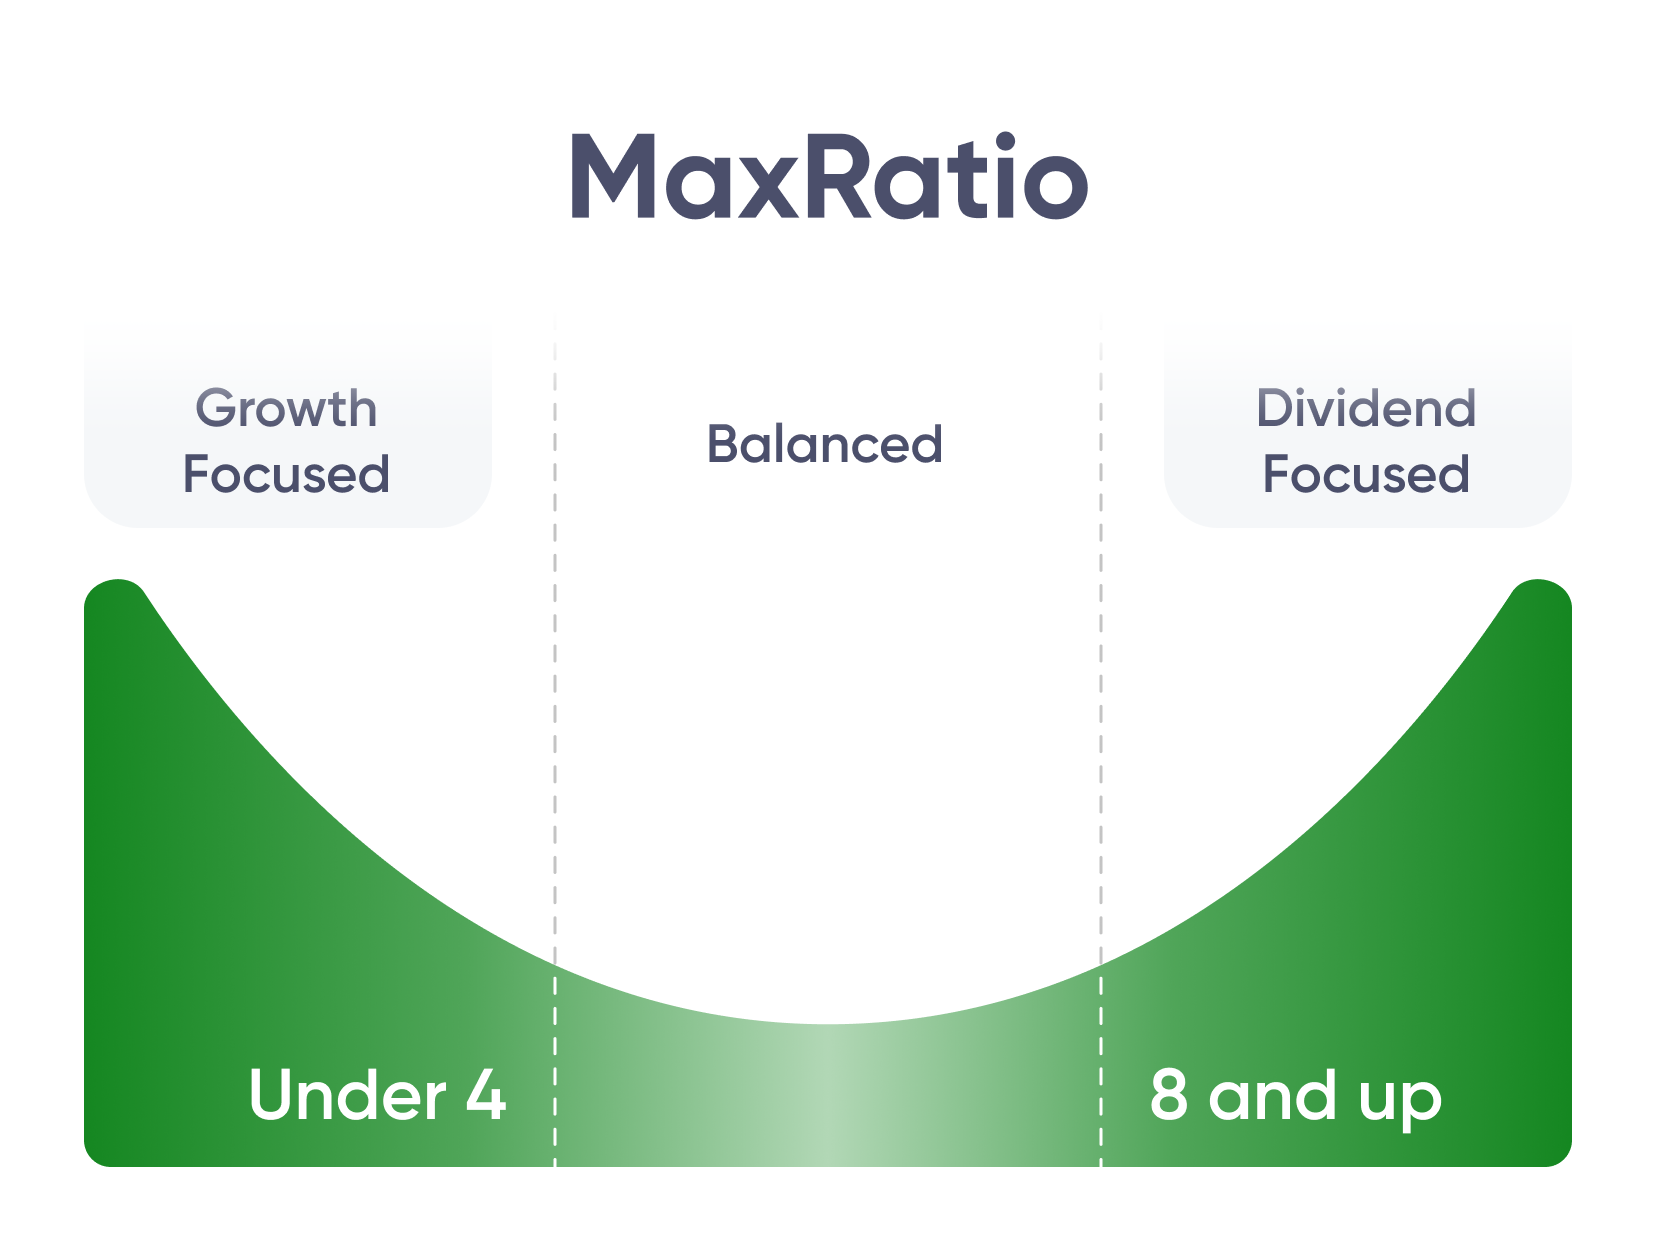
Max Ratio
–5Y Dividend Growth
0.00 %Consecutive Years
–Dividend History ACIV
1 year
3 years
5 years
10 years
15 years
MAX
11/21/2021 - 11/28/2021


Hartford Alpha Capture International Value ETF
ACIVCurrent price
40.29 USD
+0.14 USD (+0.35%)
Company
–
ISIN
-
Category
Exchange
BATS
Capitalization
97 766 441 USD
Yield for 12 month
+1.18 %
1Y
3Y
5Y
10Y
15Y
MAX
ACIV
Advanced Highlights
Total Assets
97 766 441 USDNet Expense Ratio
–Annual Holdings Turnover
–Asset HoldingACIV
Cash
Long
0.6%
Short
0%
Net Assets
0.6%
The US stocks
Long
16.31%
Short
-
Net Assets
16.31%
Stocks ex-US
Long
83.55%
Short
-
Net Assets
83.55%
Bonds
Long
1.44%
Short
-
Net Assets
1.44%
Other
Long
-
Short
-
Net Assets
-
Breakdown ACIV
1y Volatility
17.7491%
Returns YTD
8.6045%
3y Volatility
15.2962%
Returns 1Y
7.9071%
3y ExpReturn
0%
Returns 3Y
16.9813%
3y SharpRatio
0.7799%
Returns 5Y
4.6049%
Returns 10Y
Technical Indicators ACIV
For 52 Weeks
38.21 USD
40.63 USD
50 Day MA
39.64 USD
200 Day MA
39.64 USD







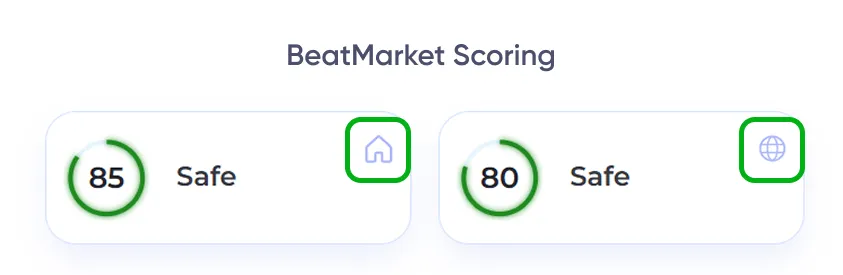
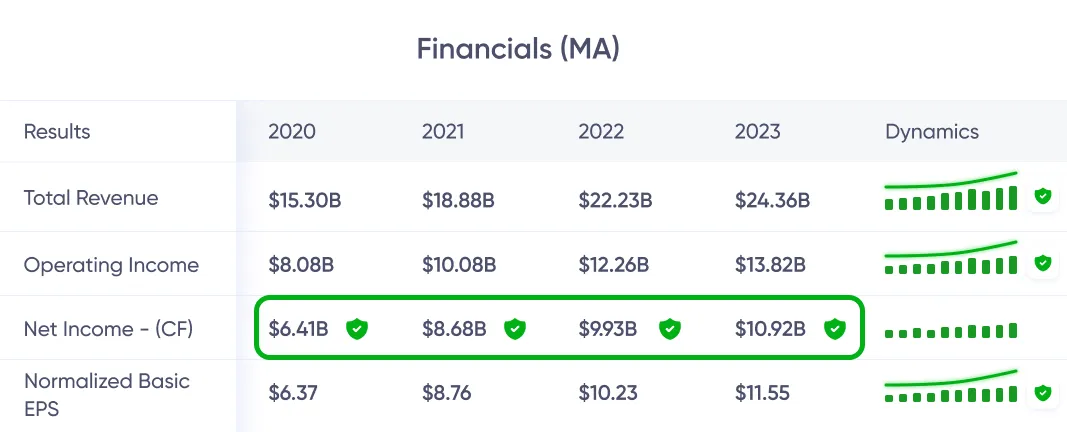
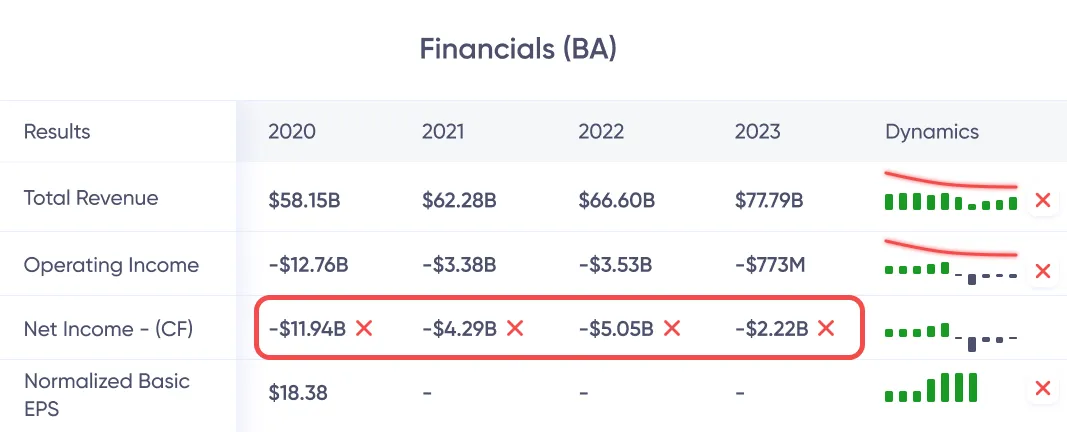


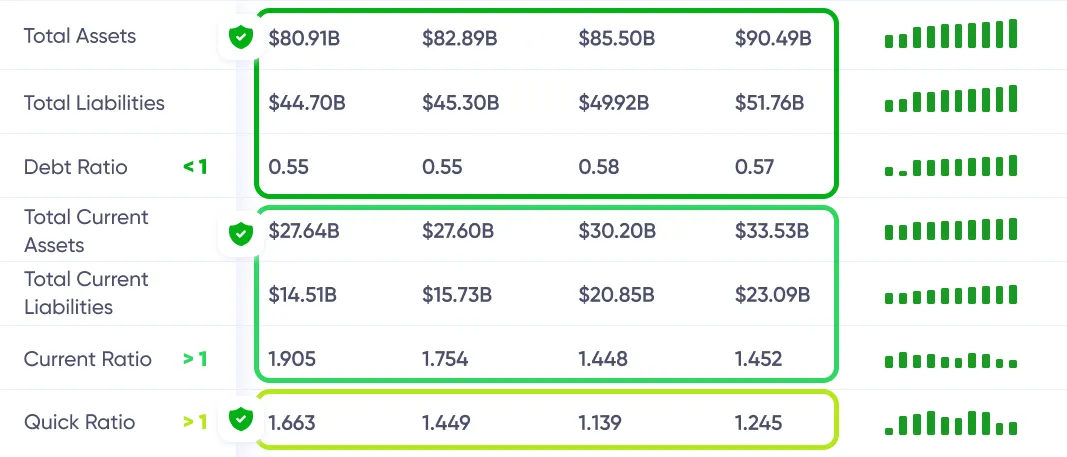
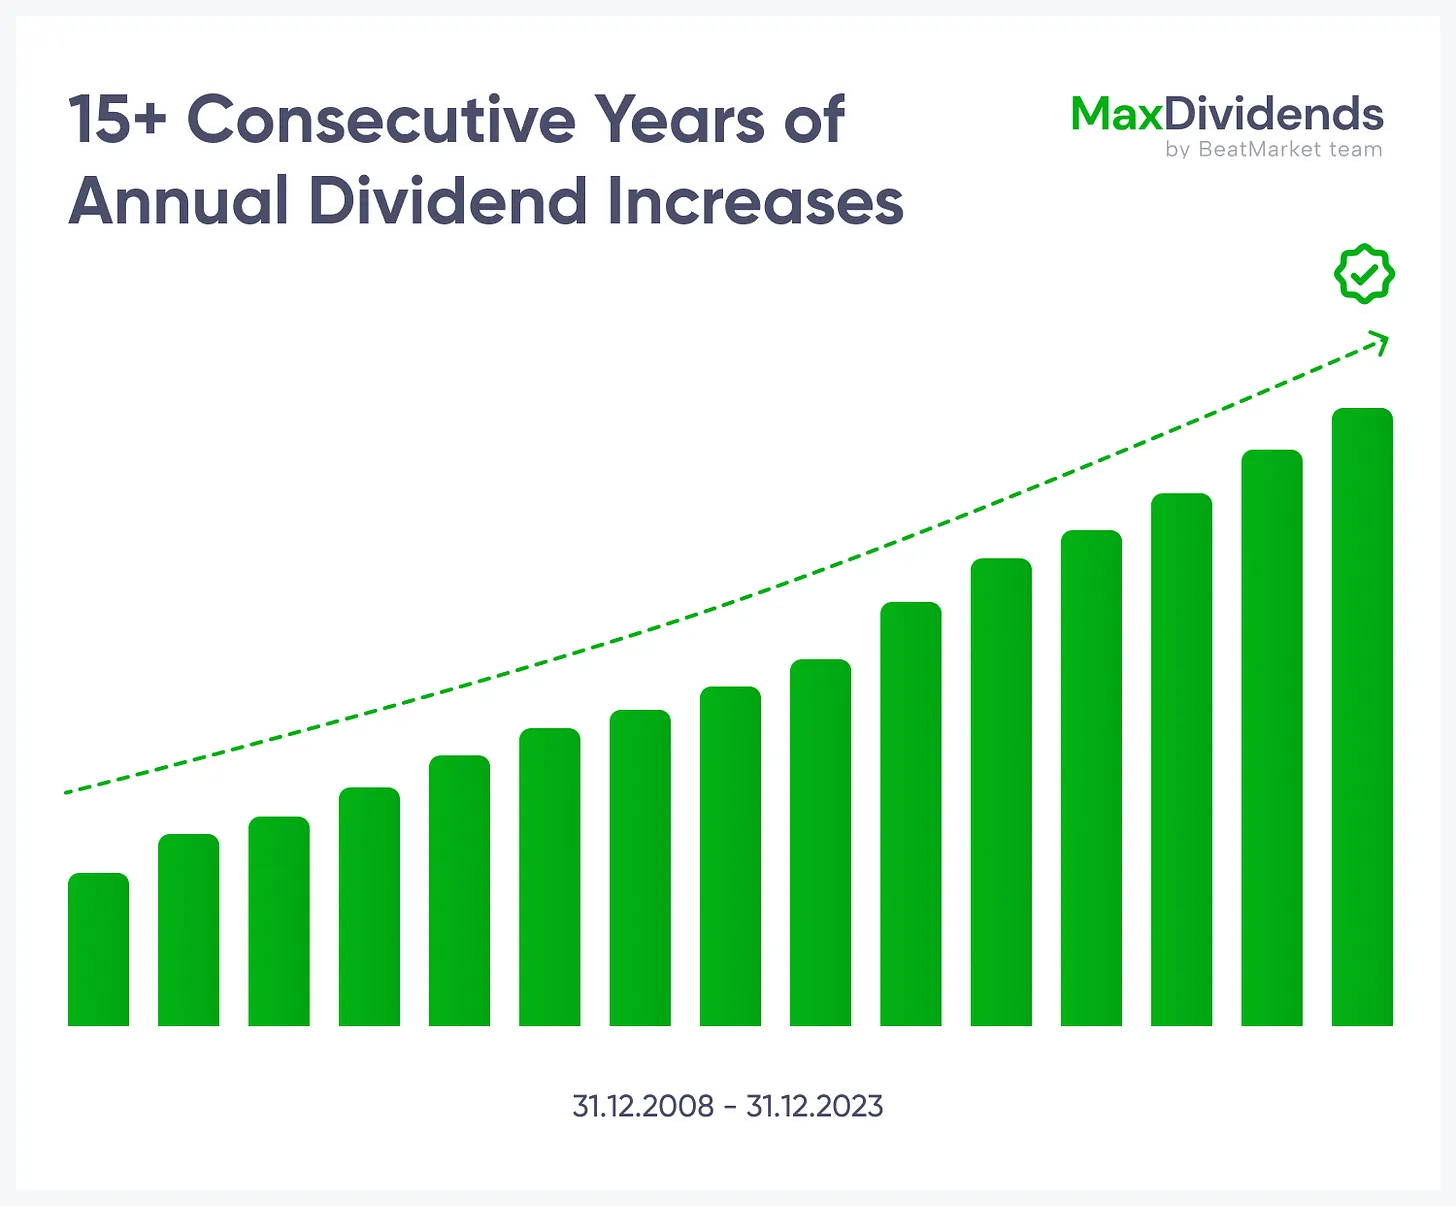
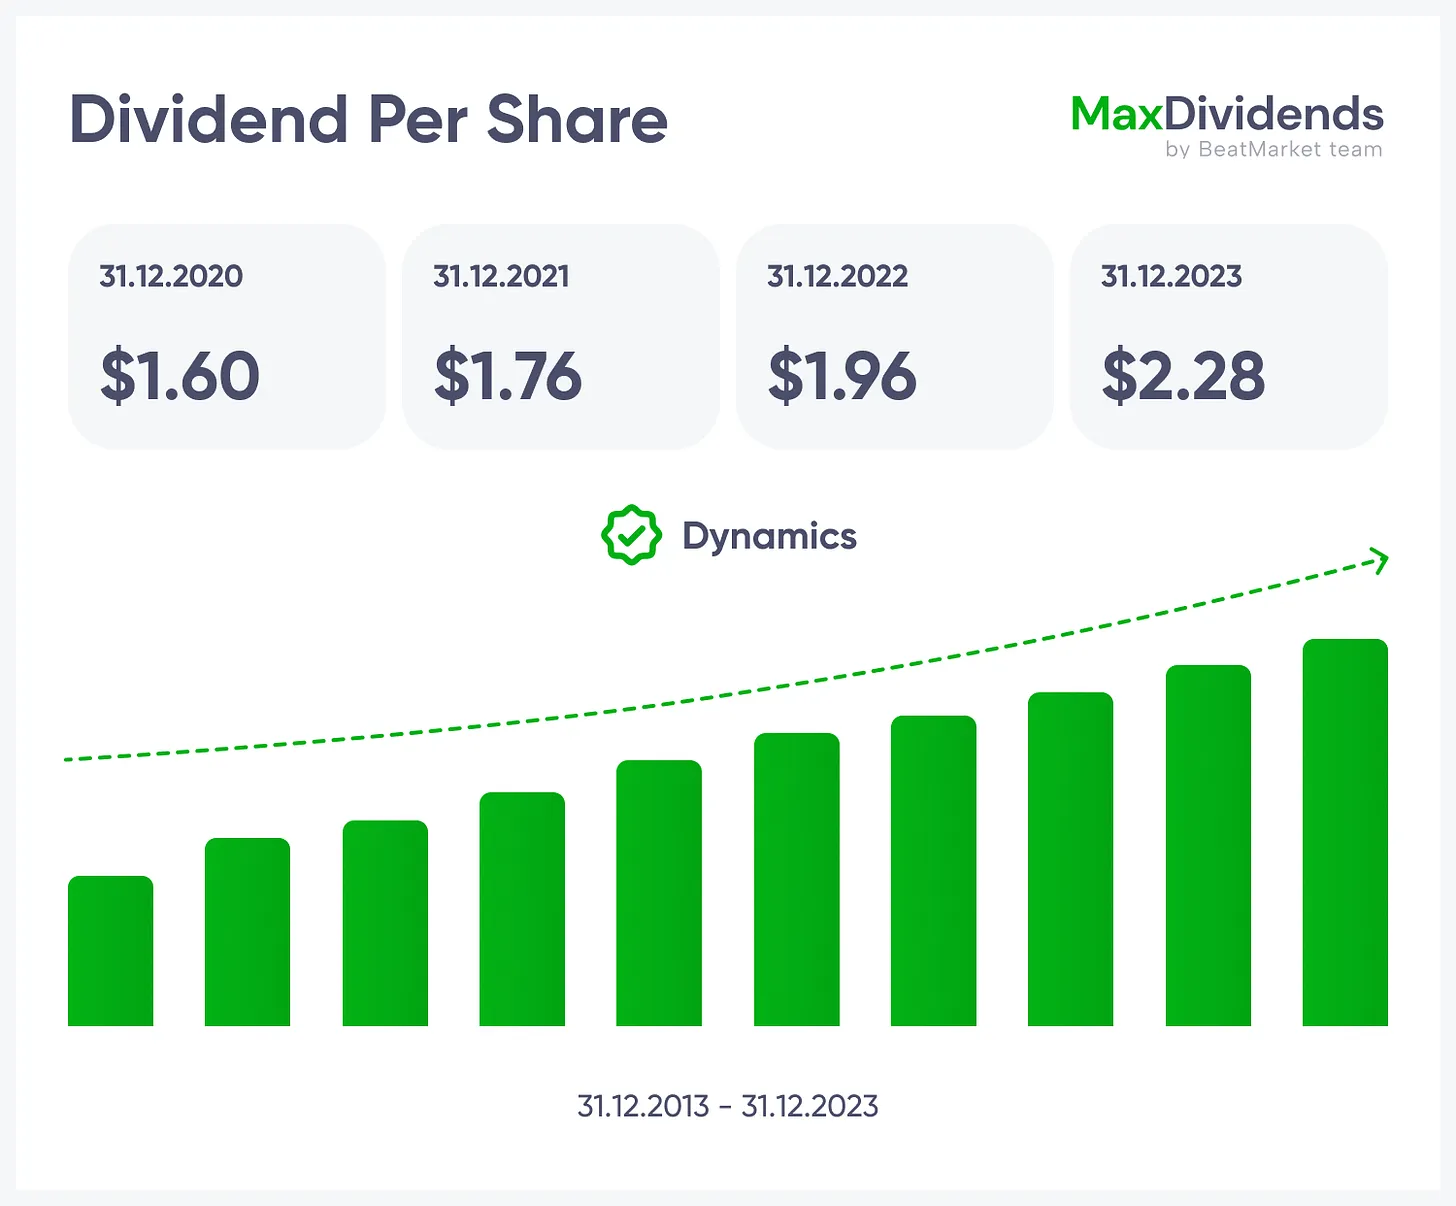
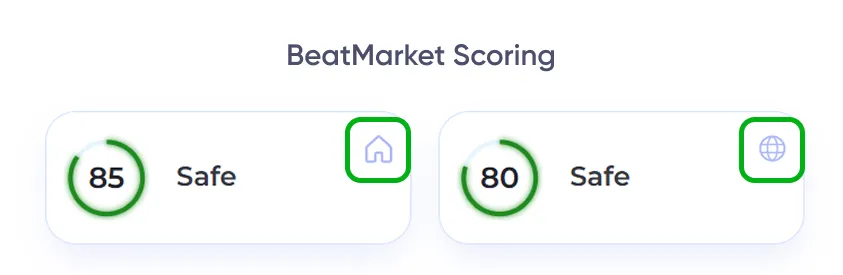
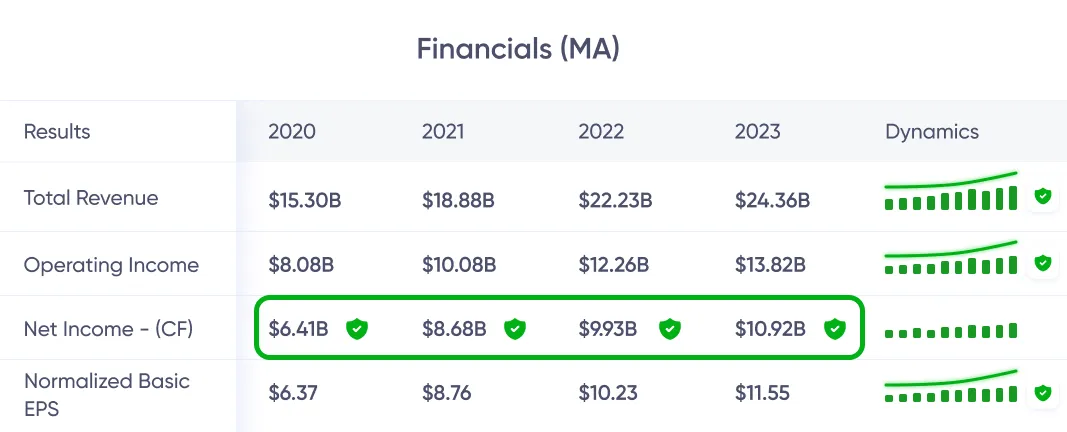
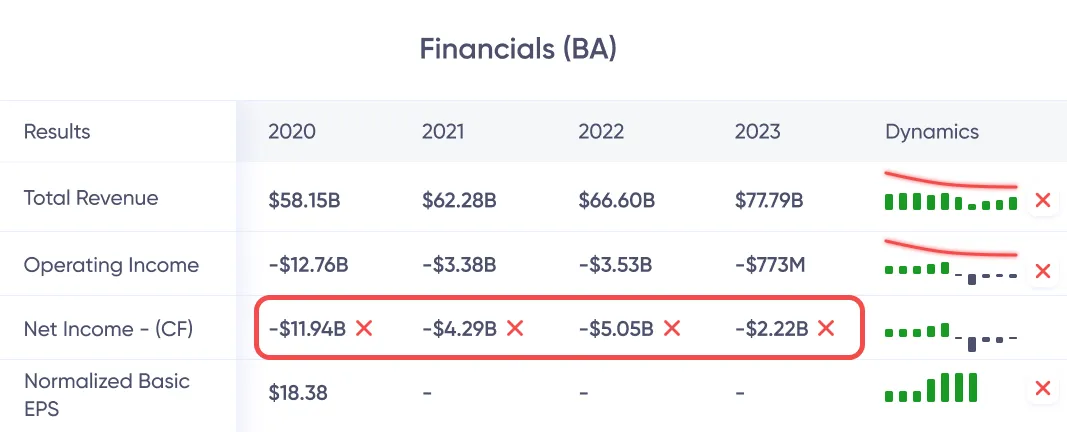


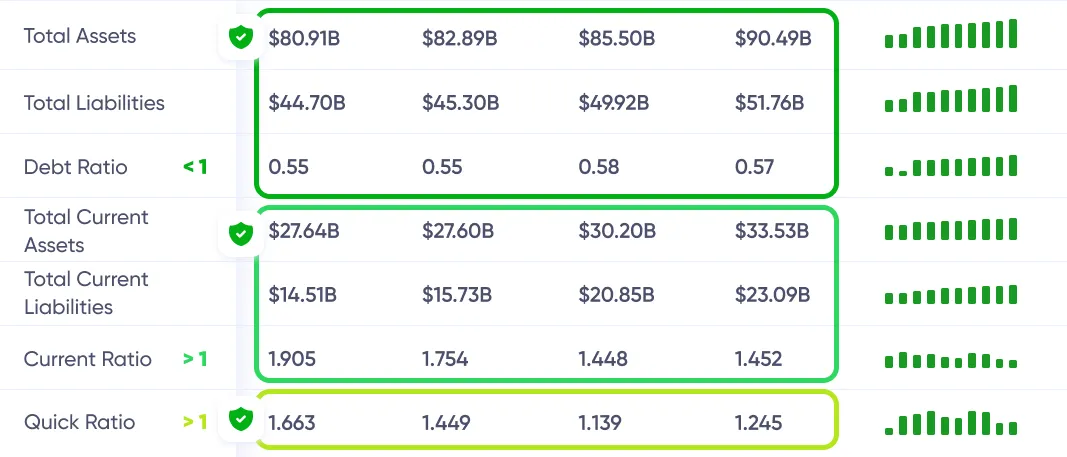
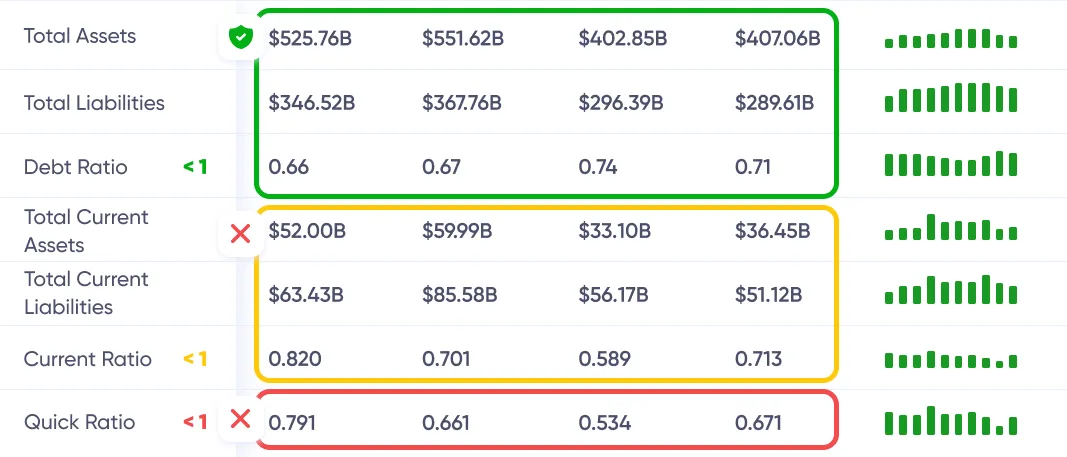

 See the whole business at a glance — what it does, how it earns, and the value it brings.
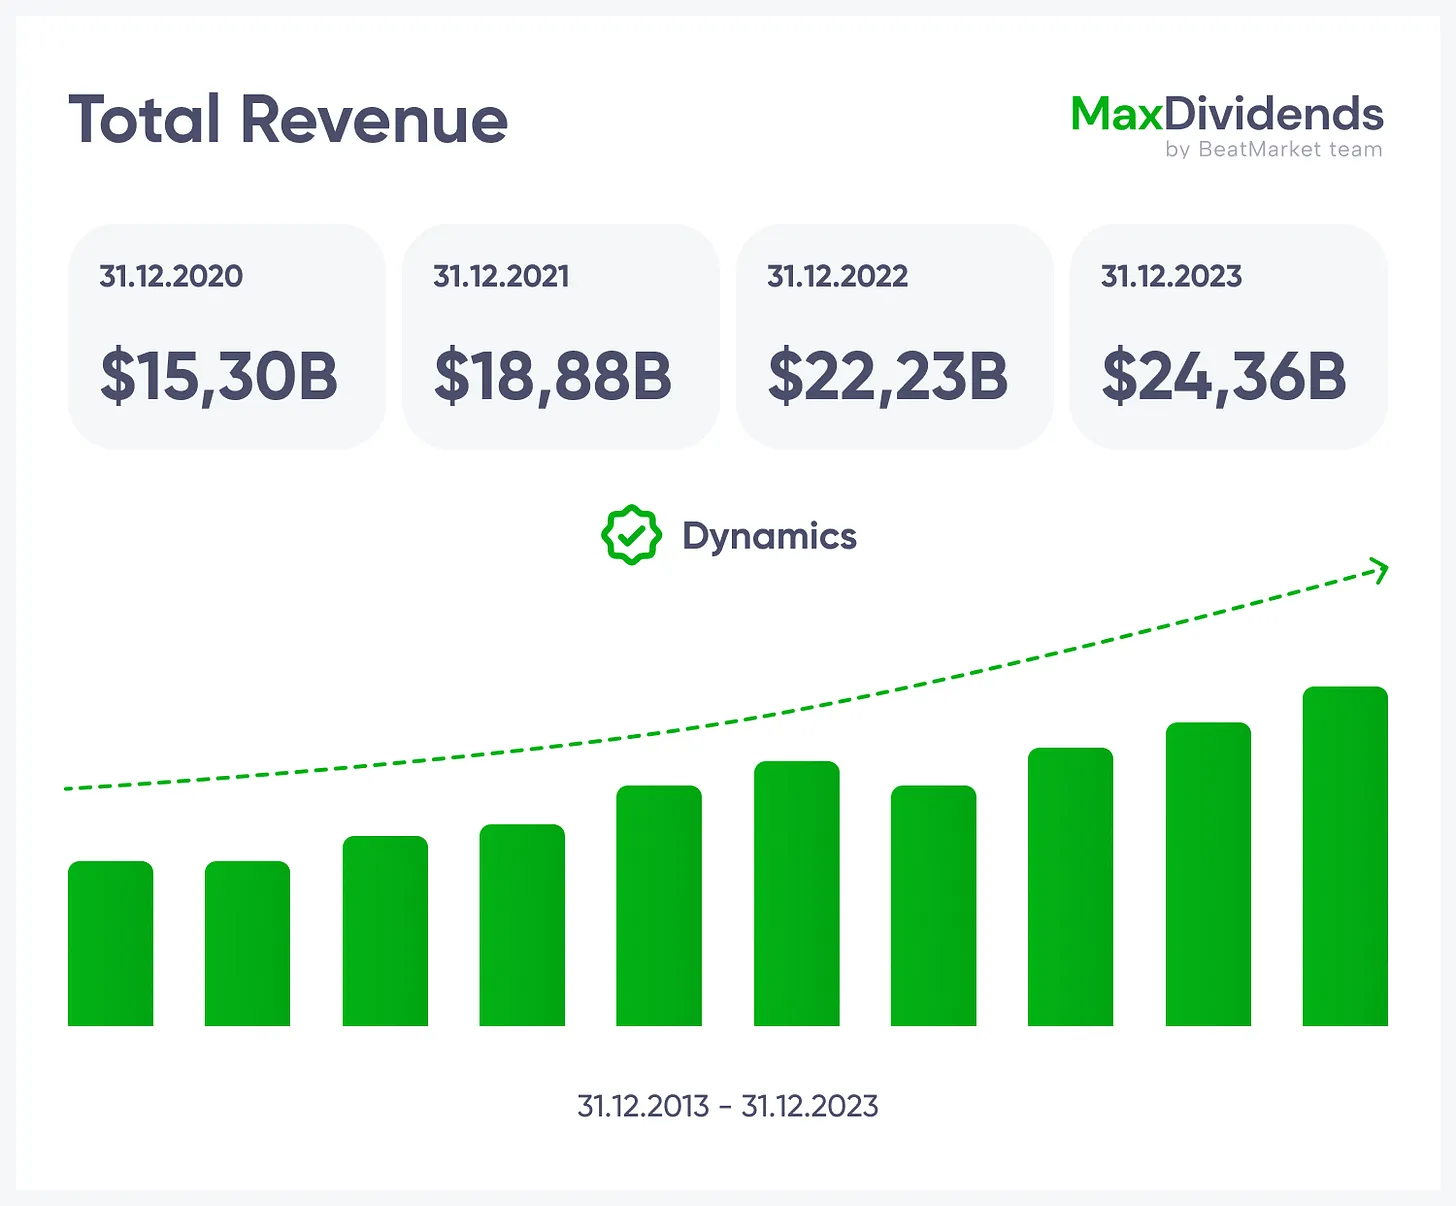
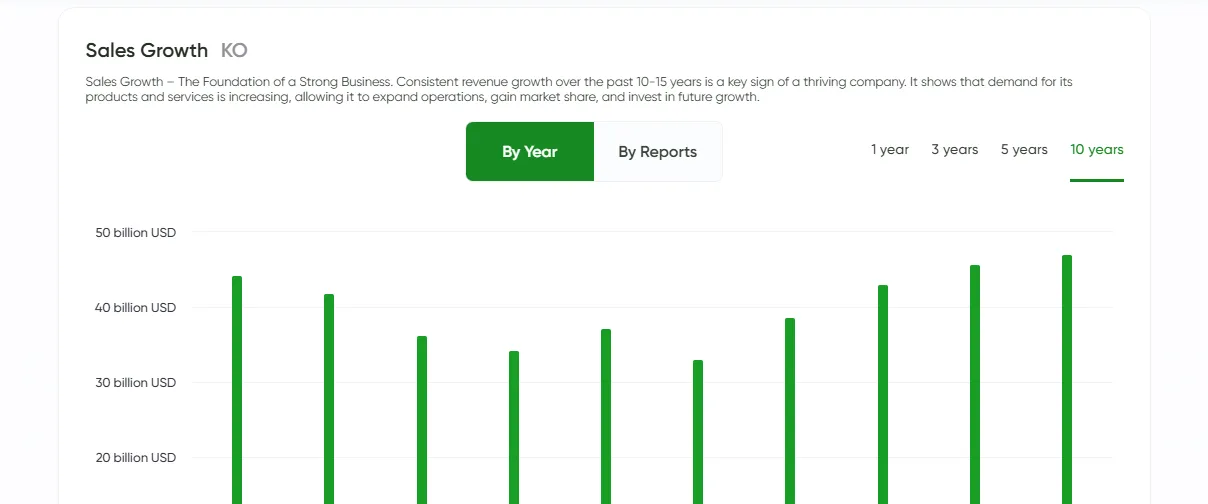 Growth trend, clear in one glance.
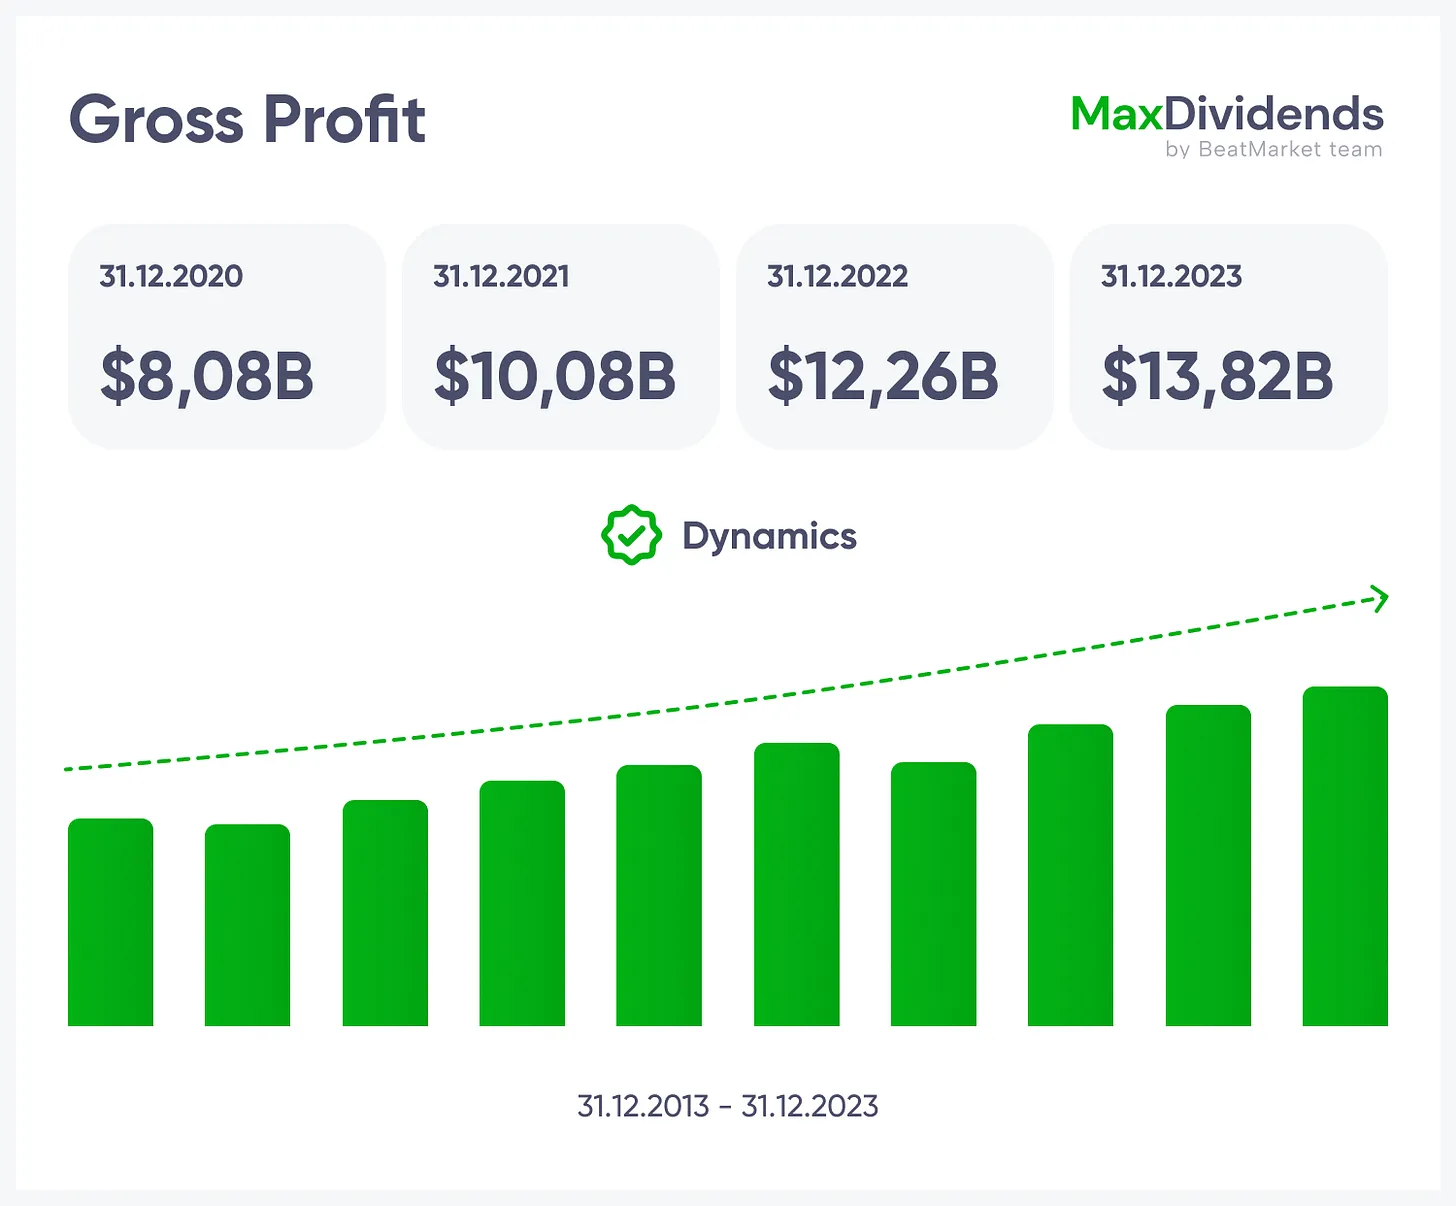
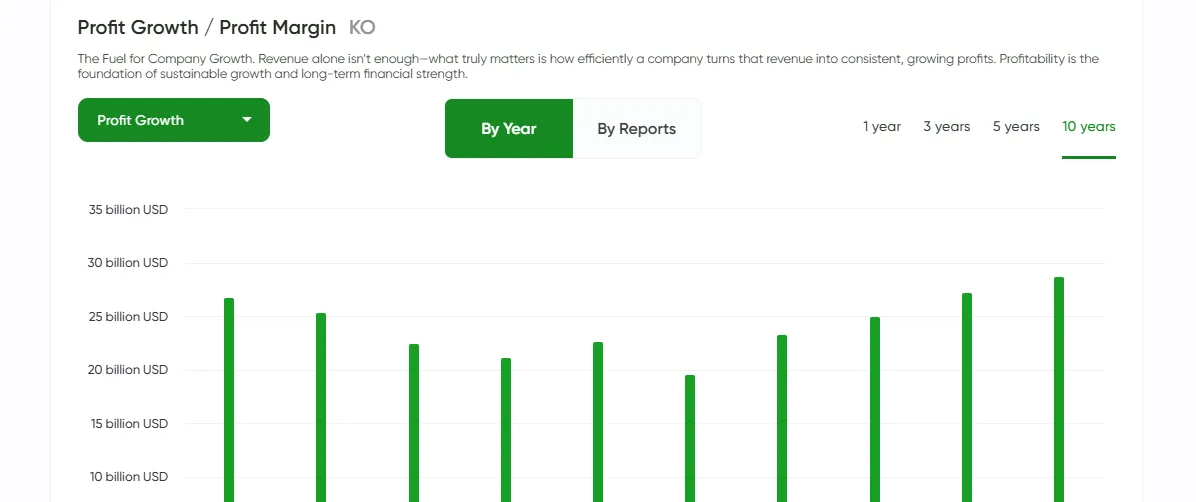 See if profits are real — instantly.
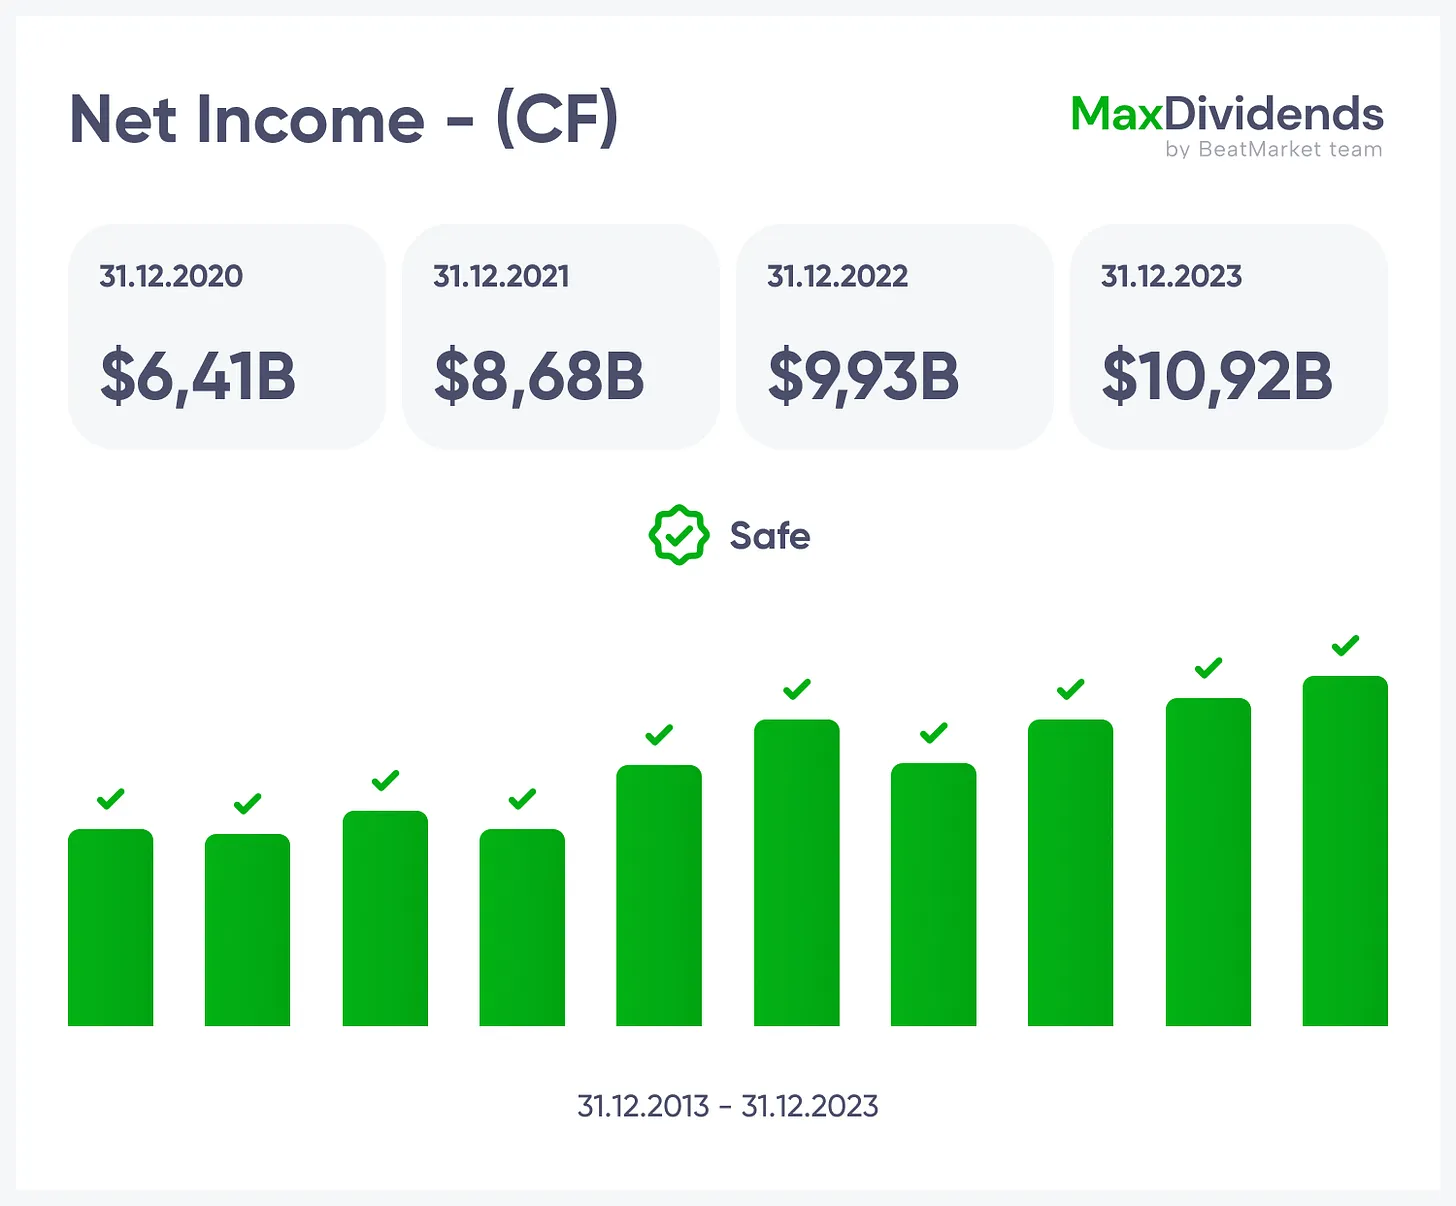
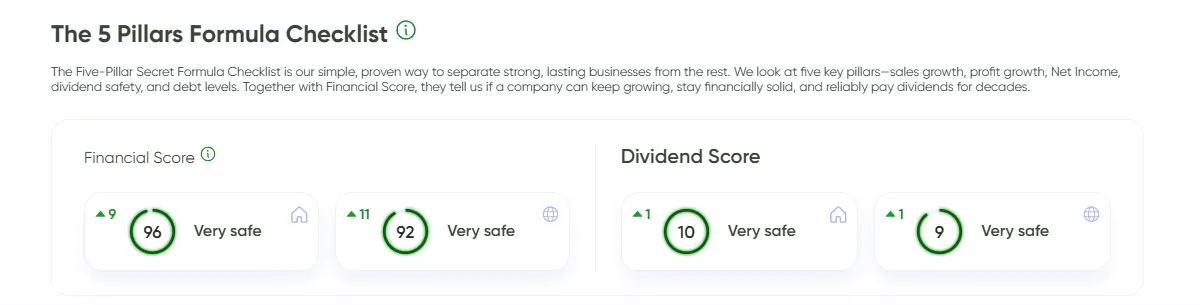
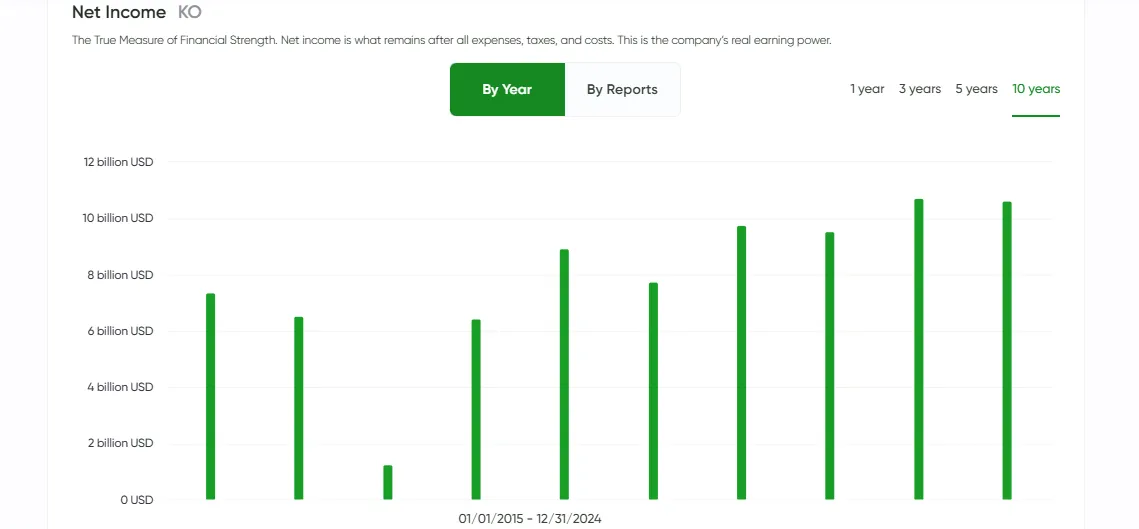 Bottom line made simple with MaxDividends.
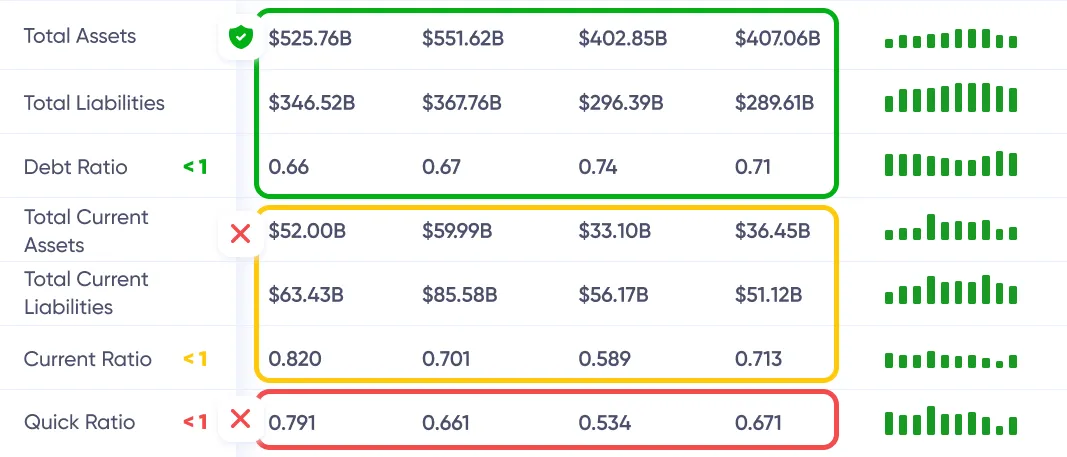
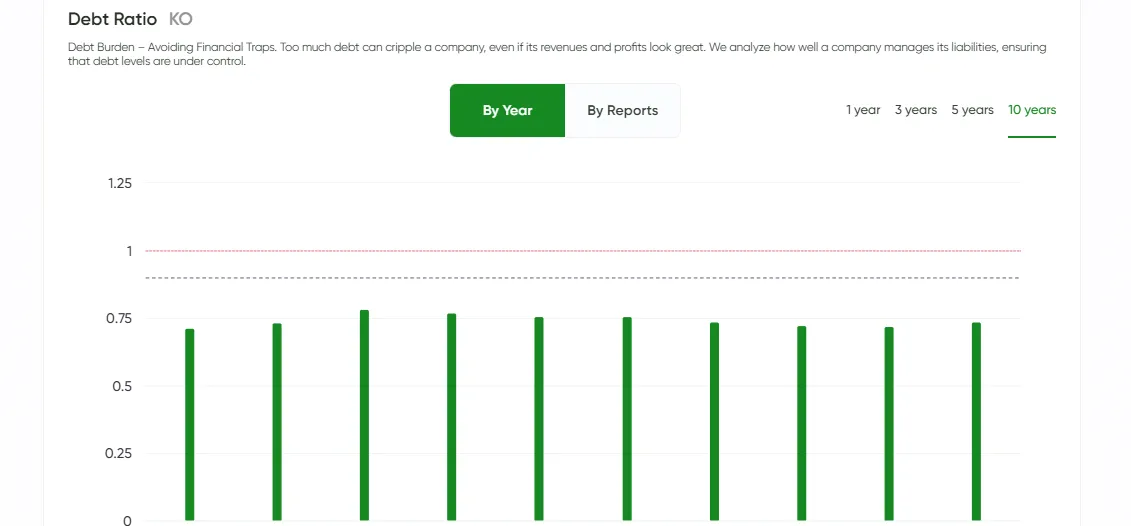 Debt risk checked for you, 24/7.
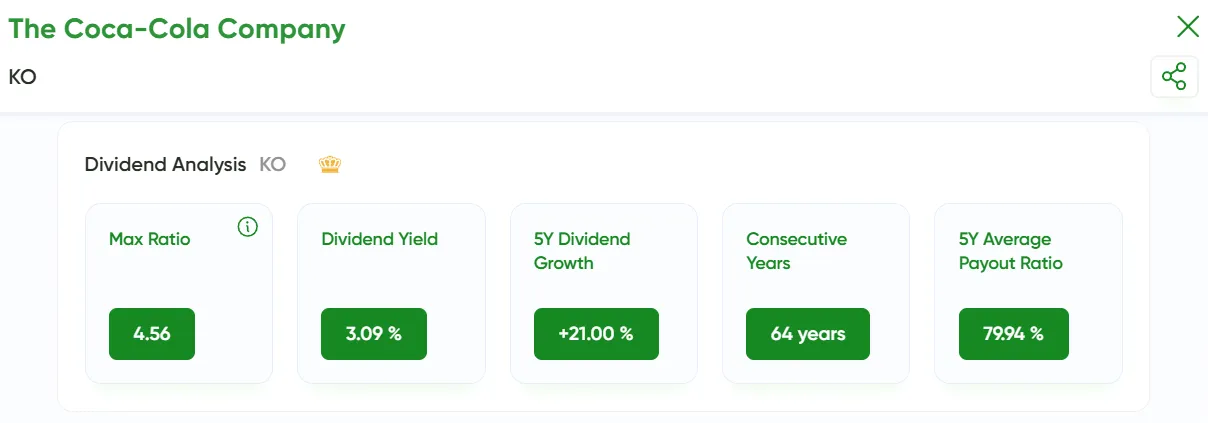
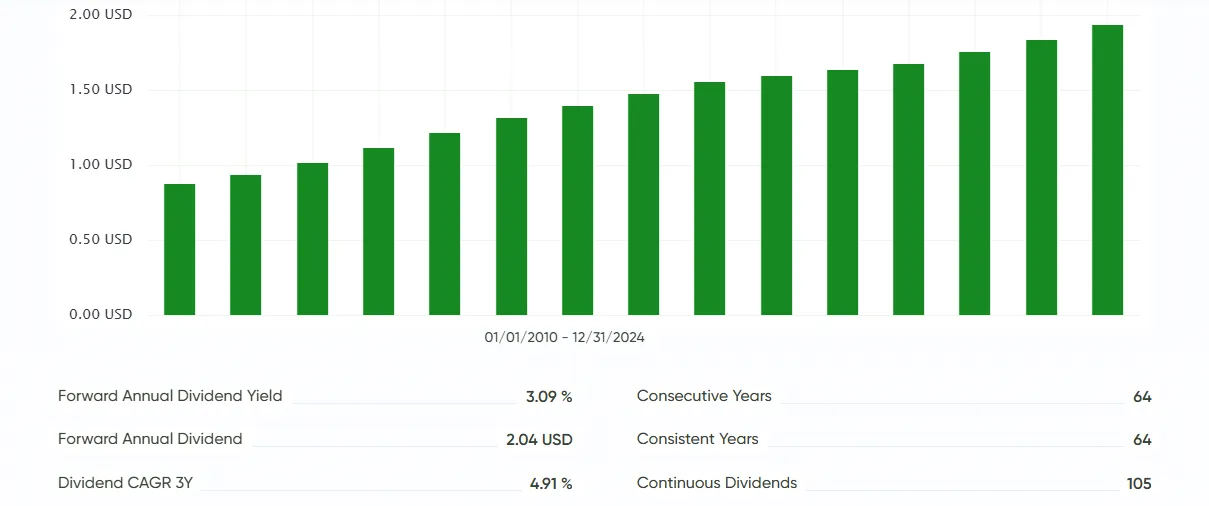
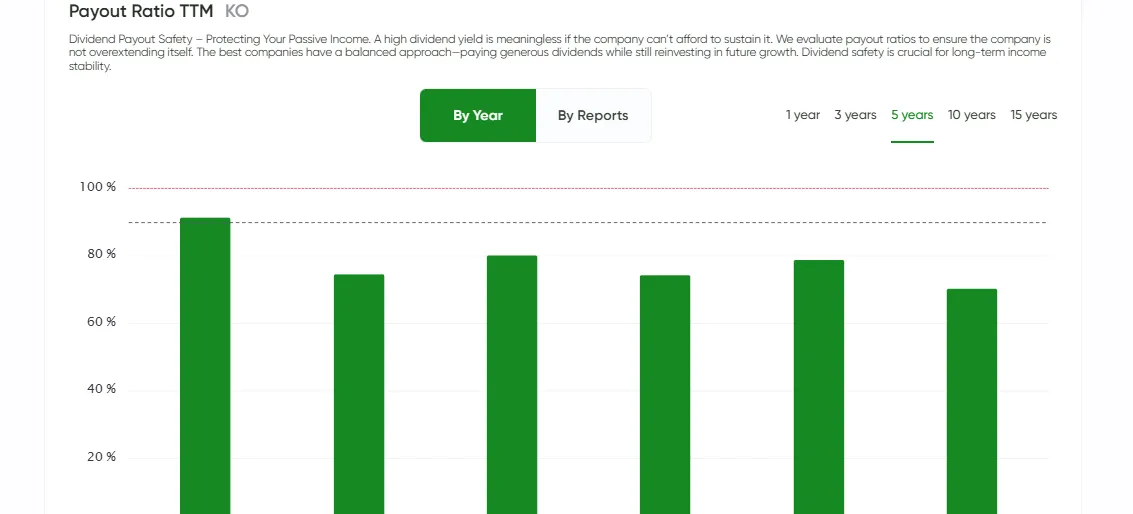 Dividend streaks and raises at your fingertips.
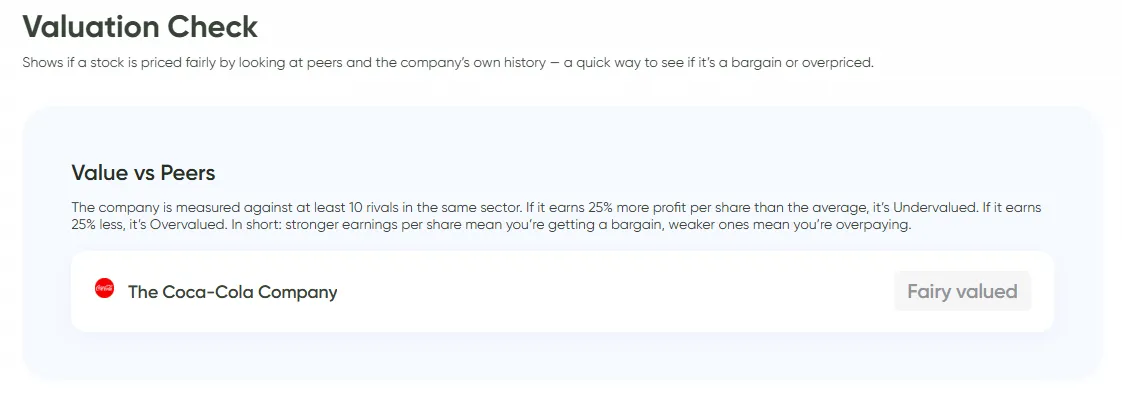 Stack the company against rivals. If it earns more per share, it's undervalued. If less, overpriced.
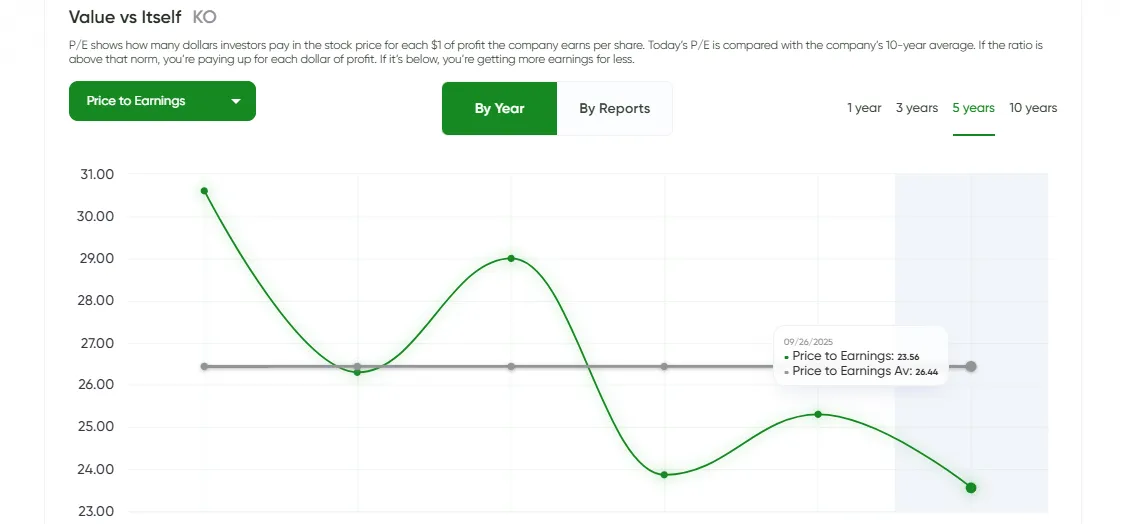 Compare today's P/E with its own 10-year history. Above average = expensive. Below = bargain.
 See if the stock trades below its assets. That's buying the business with built-in margin of safety.

 BeatStart