


Market Valuation
Fairly Valued
Internet Computer
ICP
Bitcoin Cash
BCH
Litecoin
LTC
 Market Valuation
 Consensus
 Best For
How This Company Makes Money
Dividend Analysis TECS
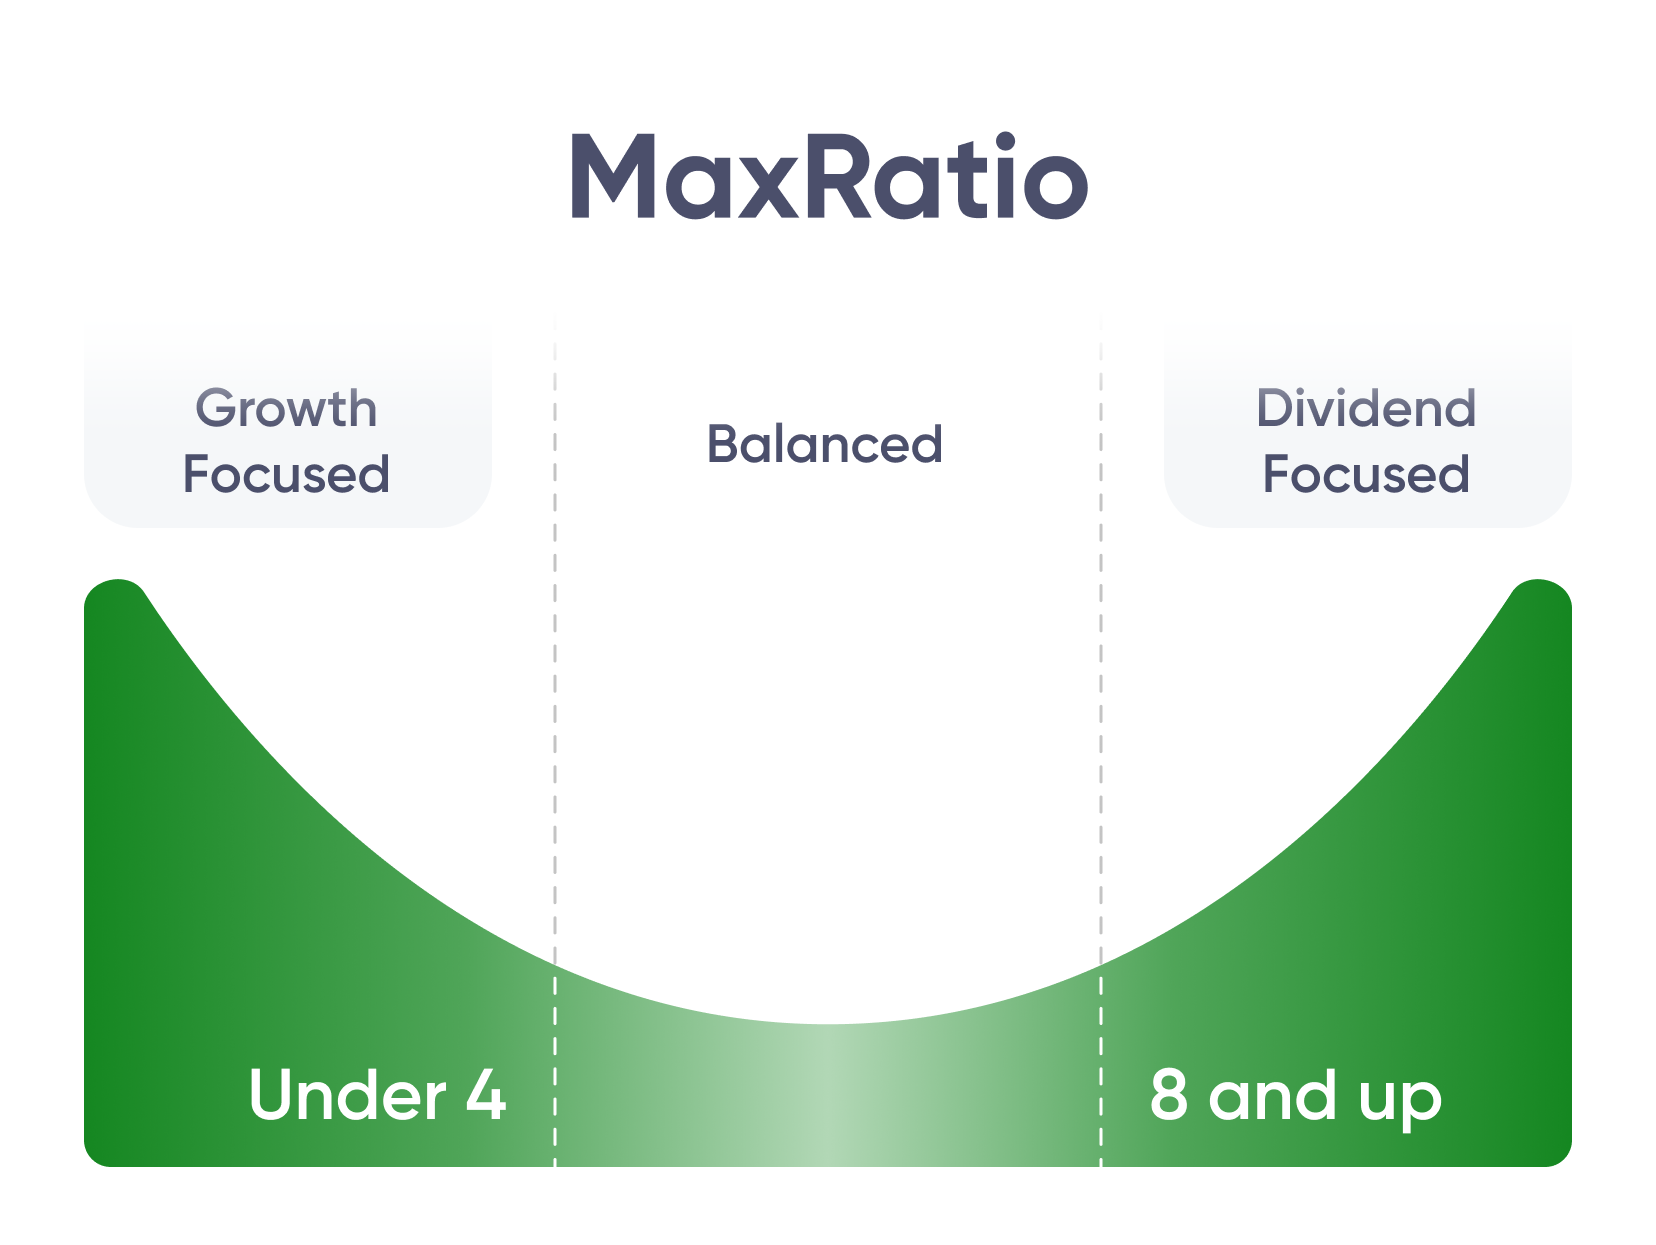
Max Ratio
–5Y Dividend Growth
-92.00 %Consecutive Years
–Dividend History TECS
1 year
3 years
5 years
10 years
15 years
11/21/2021 - 11/28/2021


Direxion Daily Technology Bear 3X Shares
TECSCurrent price
51.40 USD
-0.52 USD (-1.00%)
Company
www.direxionfunds.com
ISIN
US25460G3939
Category
Trading--Inverse Equity
Exchange
NYSE ARCA
Capitalization
73 769 070 USD
Yield for 12 month
+160.52 %
1Y
3Y
5Y
10Y
15Y
TECS
Advanced Highlights
Total Assets
73 769 070 USDNet Expense Ratio
1.10 %Annual Holdings Turnover
–Asset HoldingTECS
Cash
Long
127.4%
Short
1.27%
Net Assets
126.13%
The US stocks
Long
-
Short
-
Net Assets
-
Stocks ex-US
Long
1.38%
Short
27.51%
Net Assets
-26.13%
Bonds
Long
-
Short
-
Net Assets
-
Other
Long
-
Short
-
Net Assets
-
Breakdown TECS
1y Volatility
73.45%
Returns YTD
-66.02%
3y Volatility
59.30%
Returns 1Y
-71.21%
3y ExpReturn
0.00%
Returns 3Y
-64.72%
3y SharpRatio
-1.35%
Returns 5Y
-56.53%
Returns 10Y
-61.61%
Technical Indicators TECS
For 52 Weeks
51.18 USD
238.41 USD
50 Day MA
66.16 USD
200 Day MA
123.32 USD










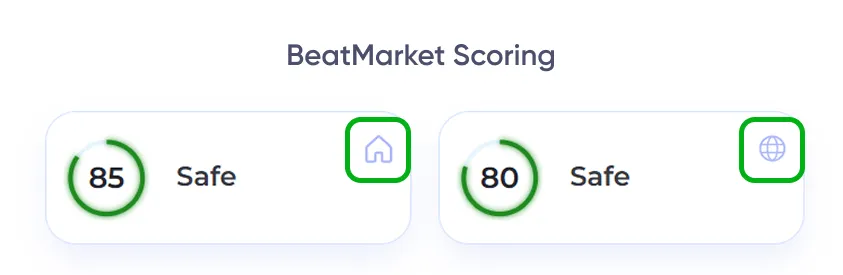
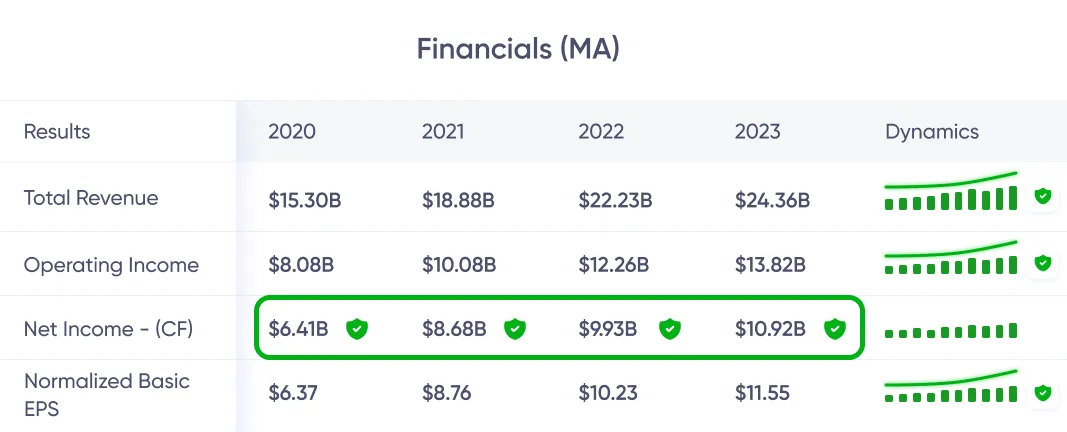
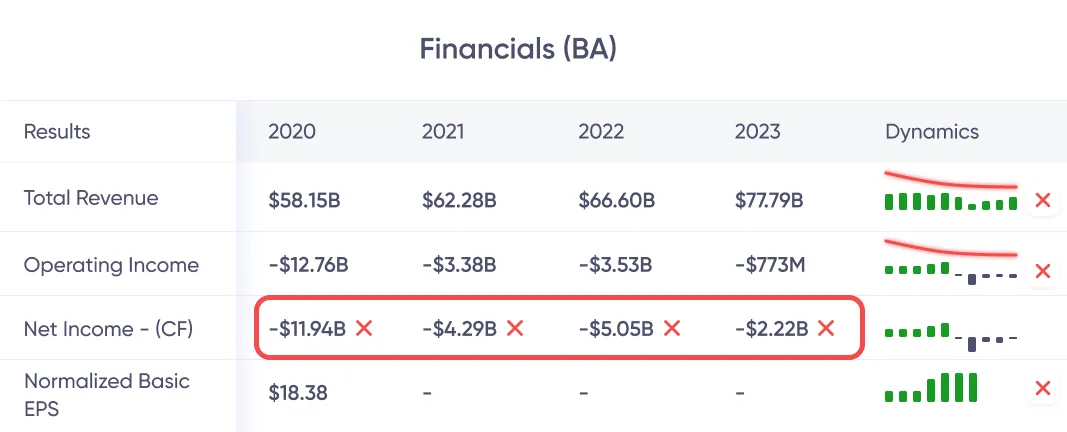


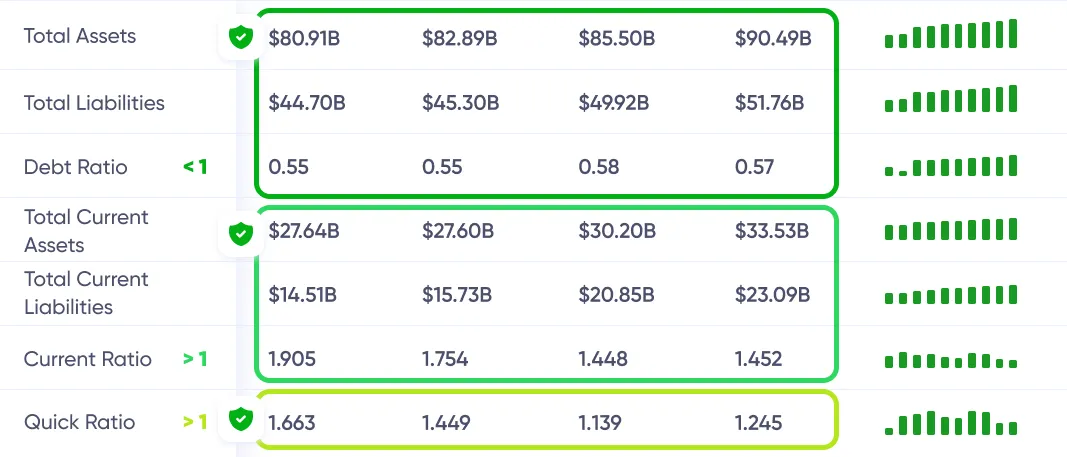
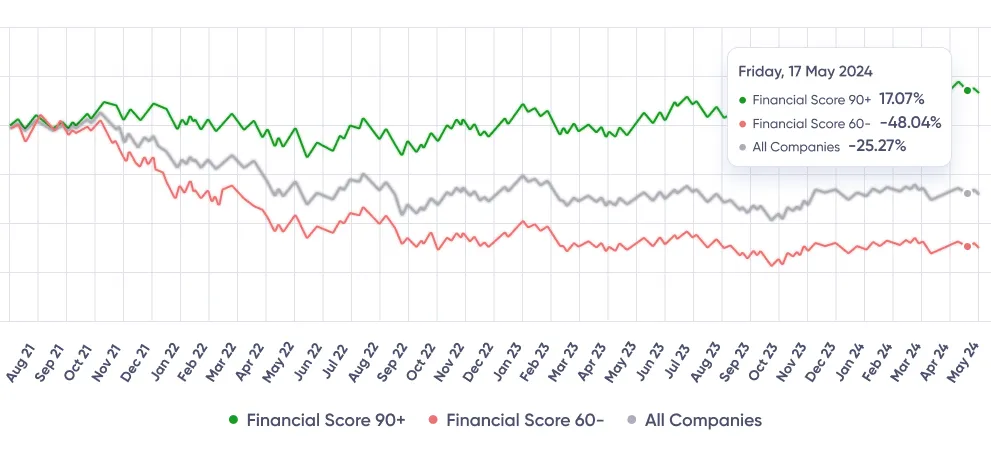
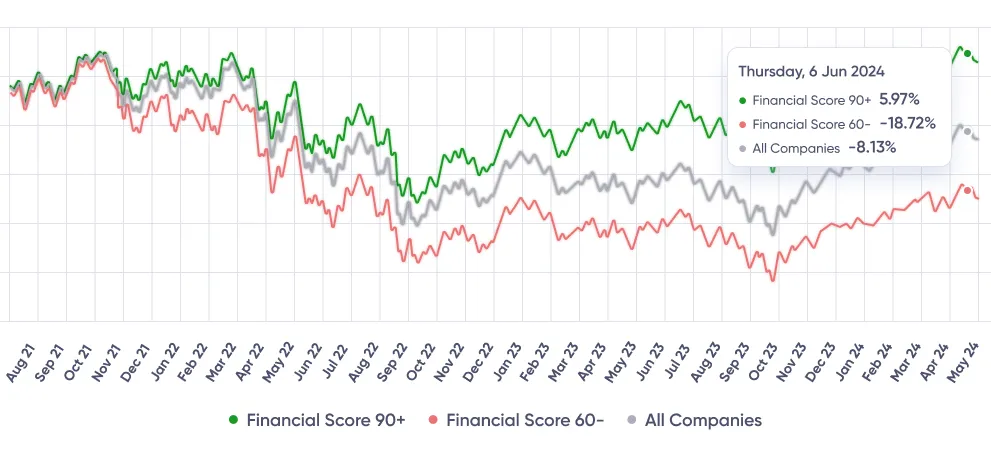
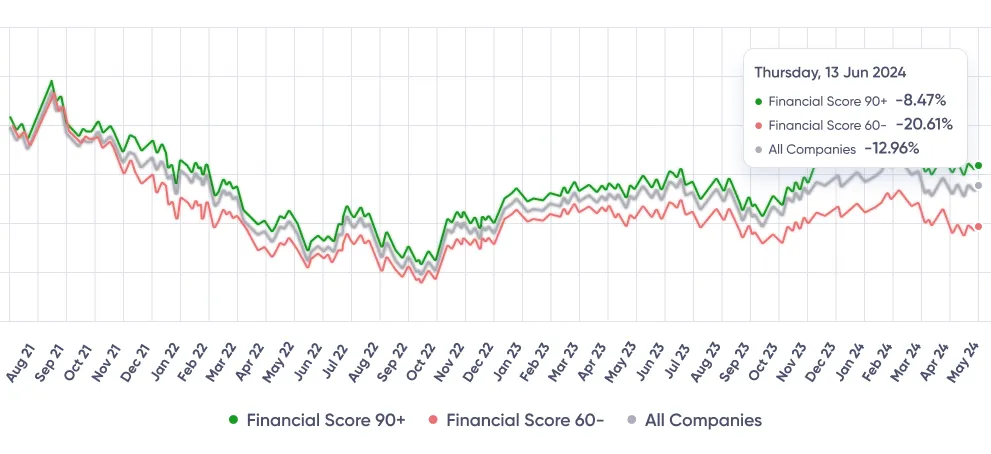
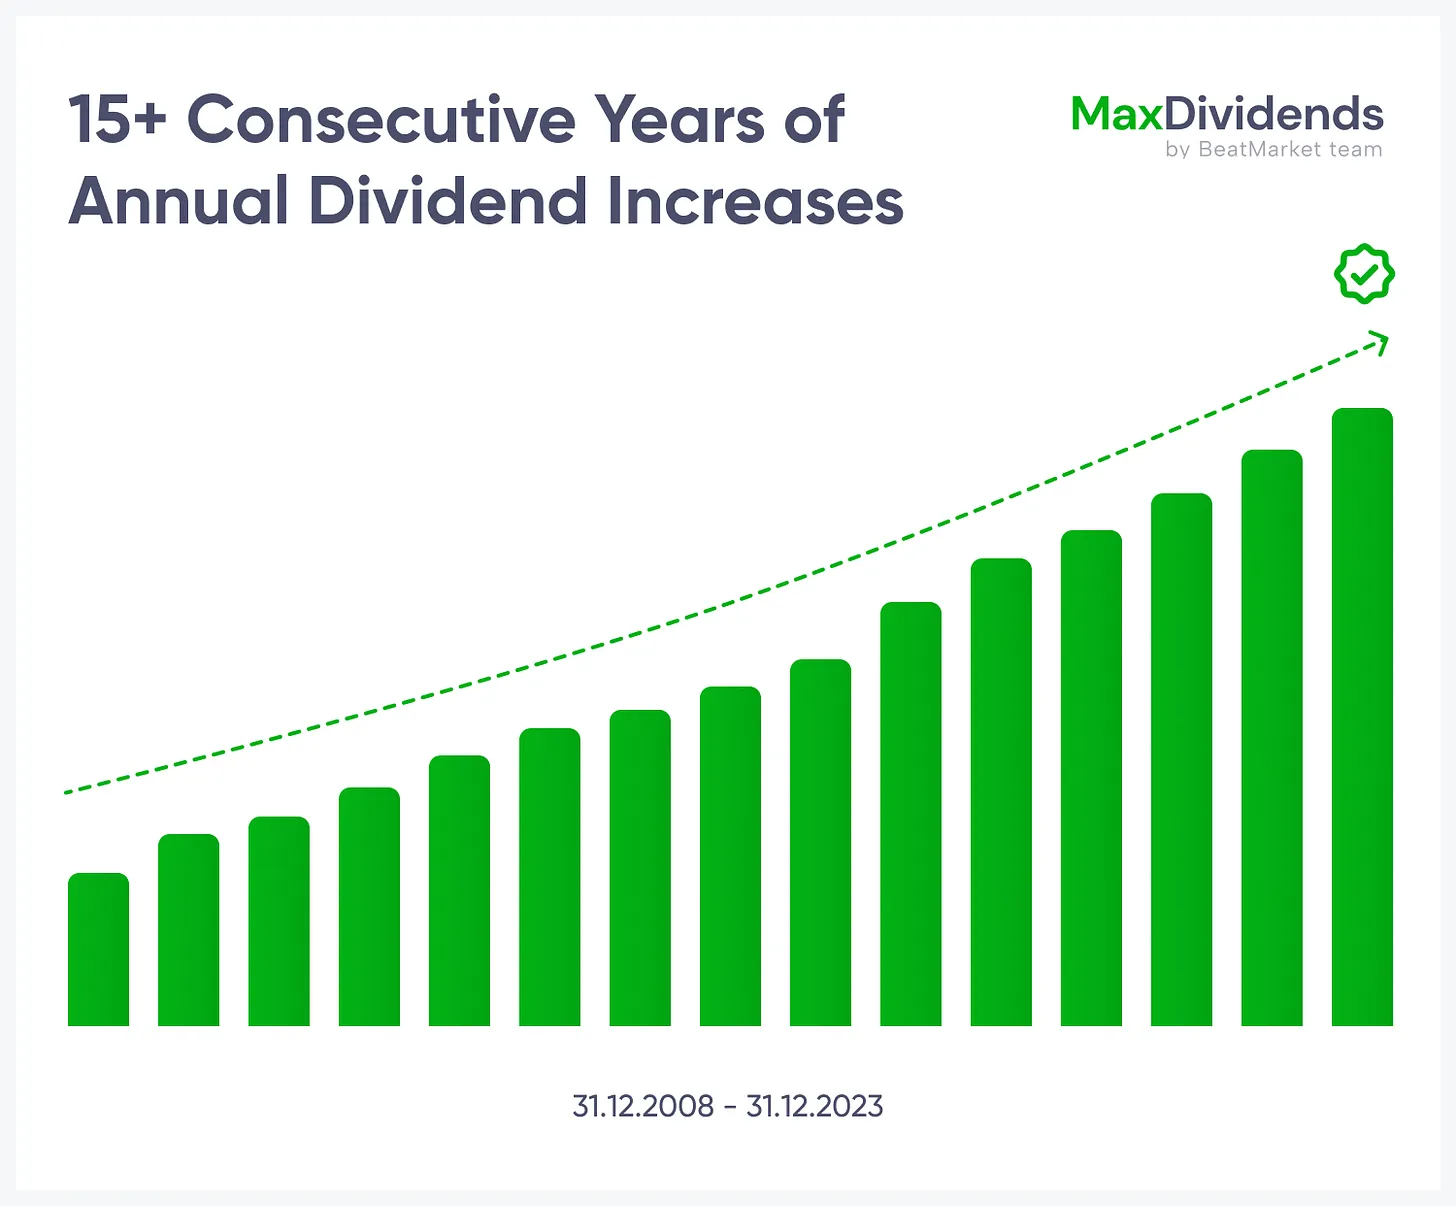
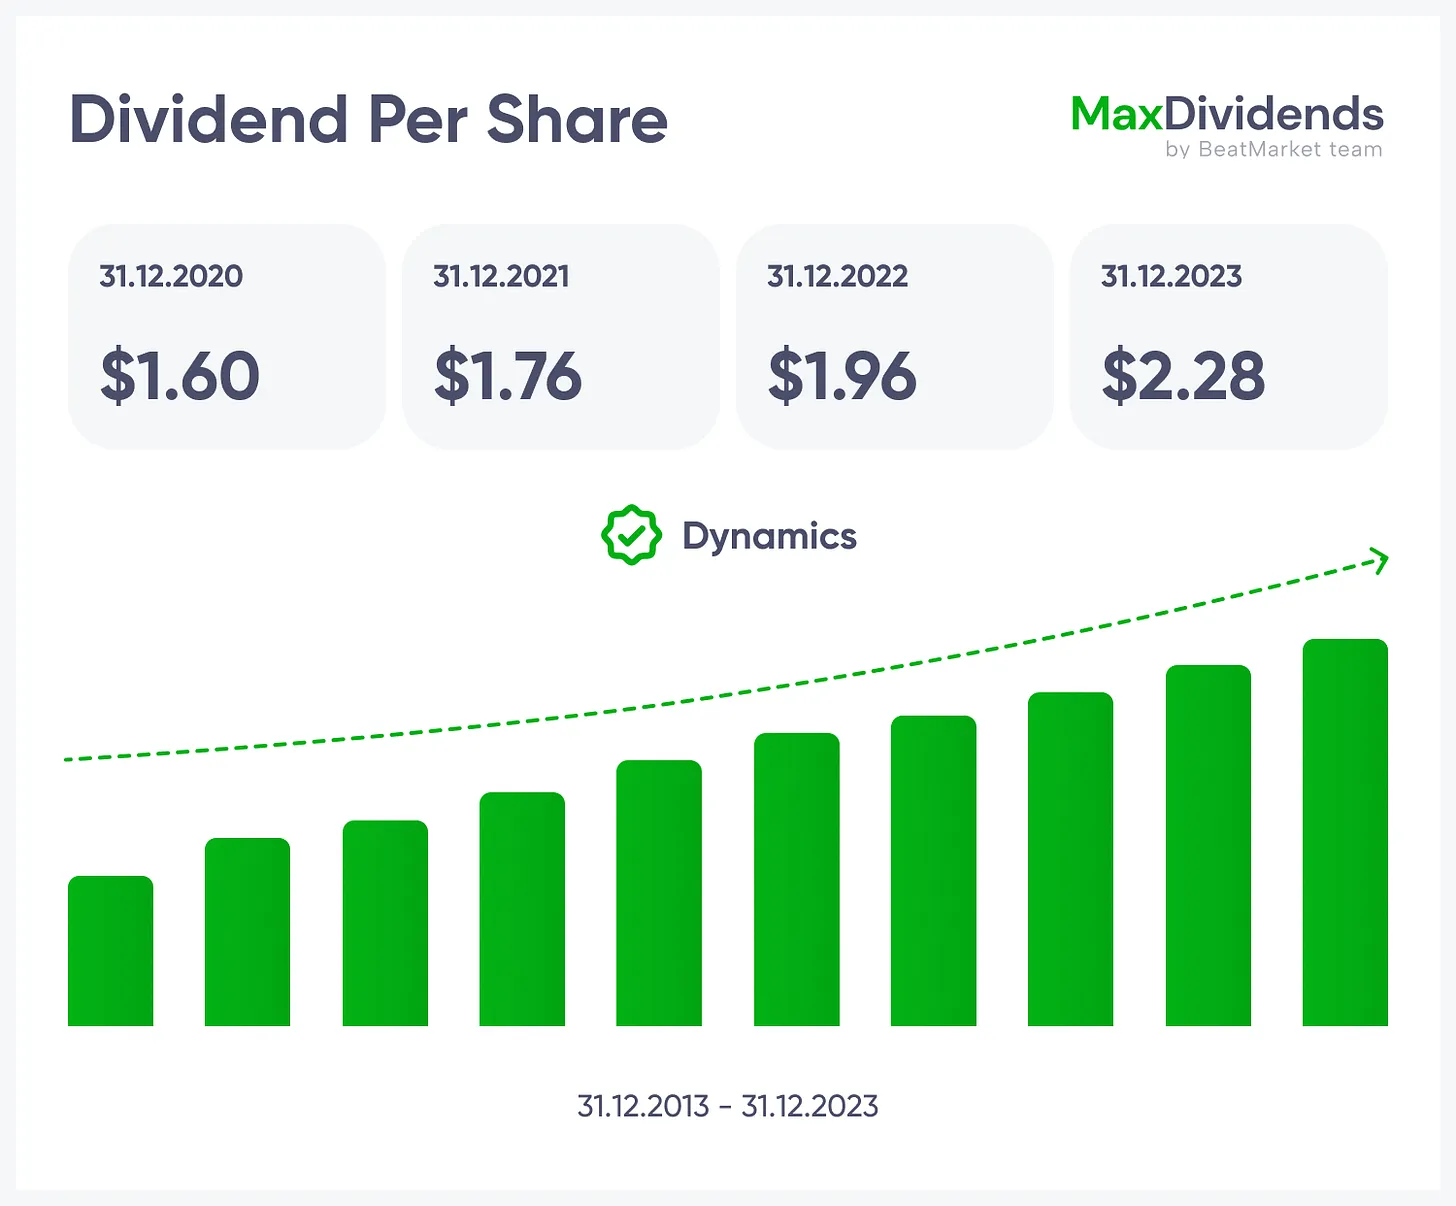
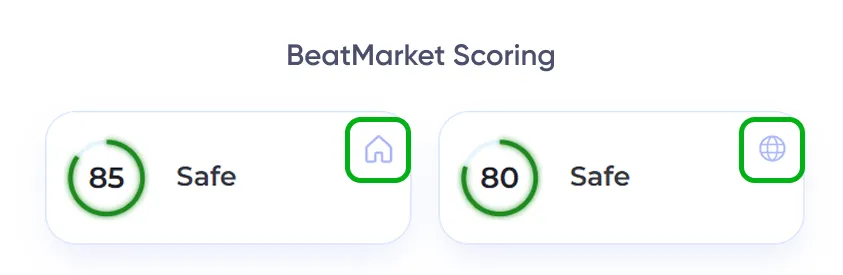
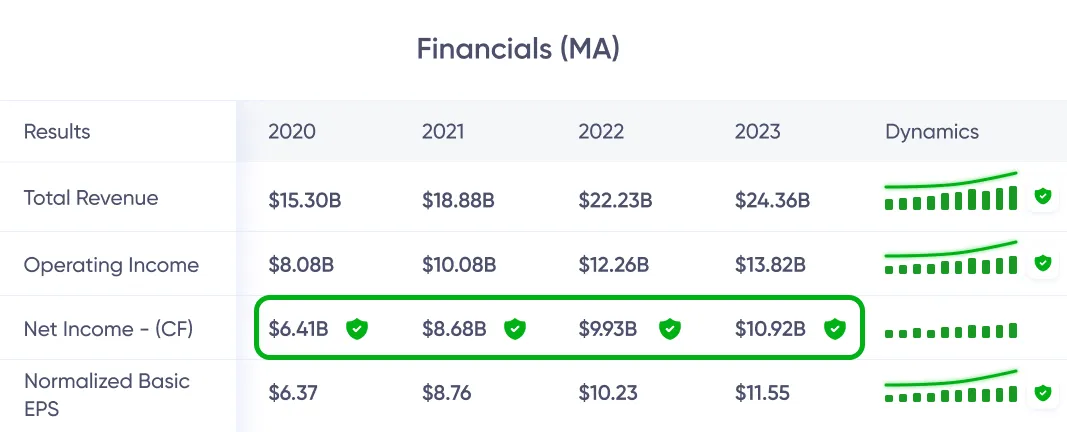



 See the whole business at a glance — what it does, how it earns, and the value it brings.
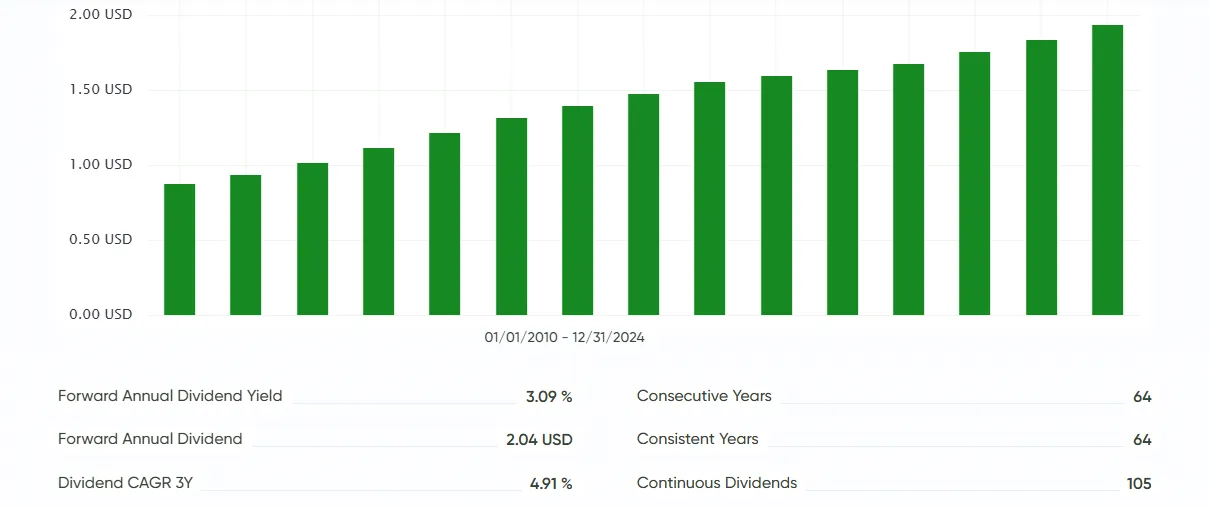
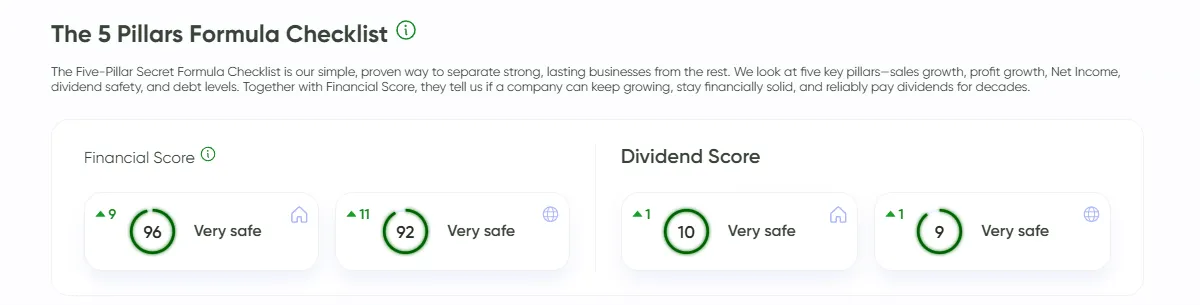
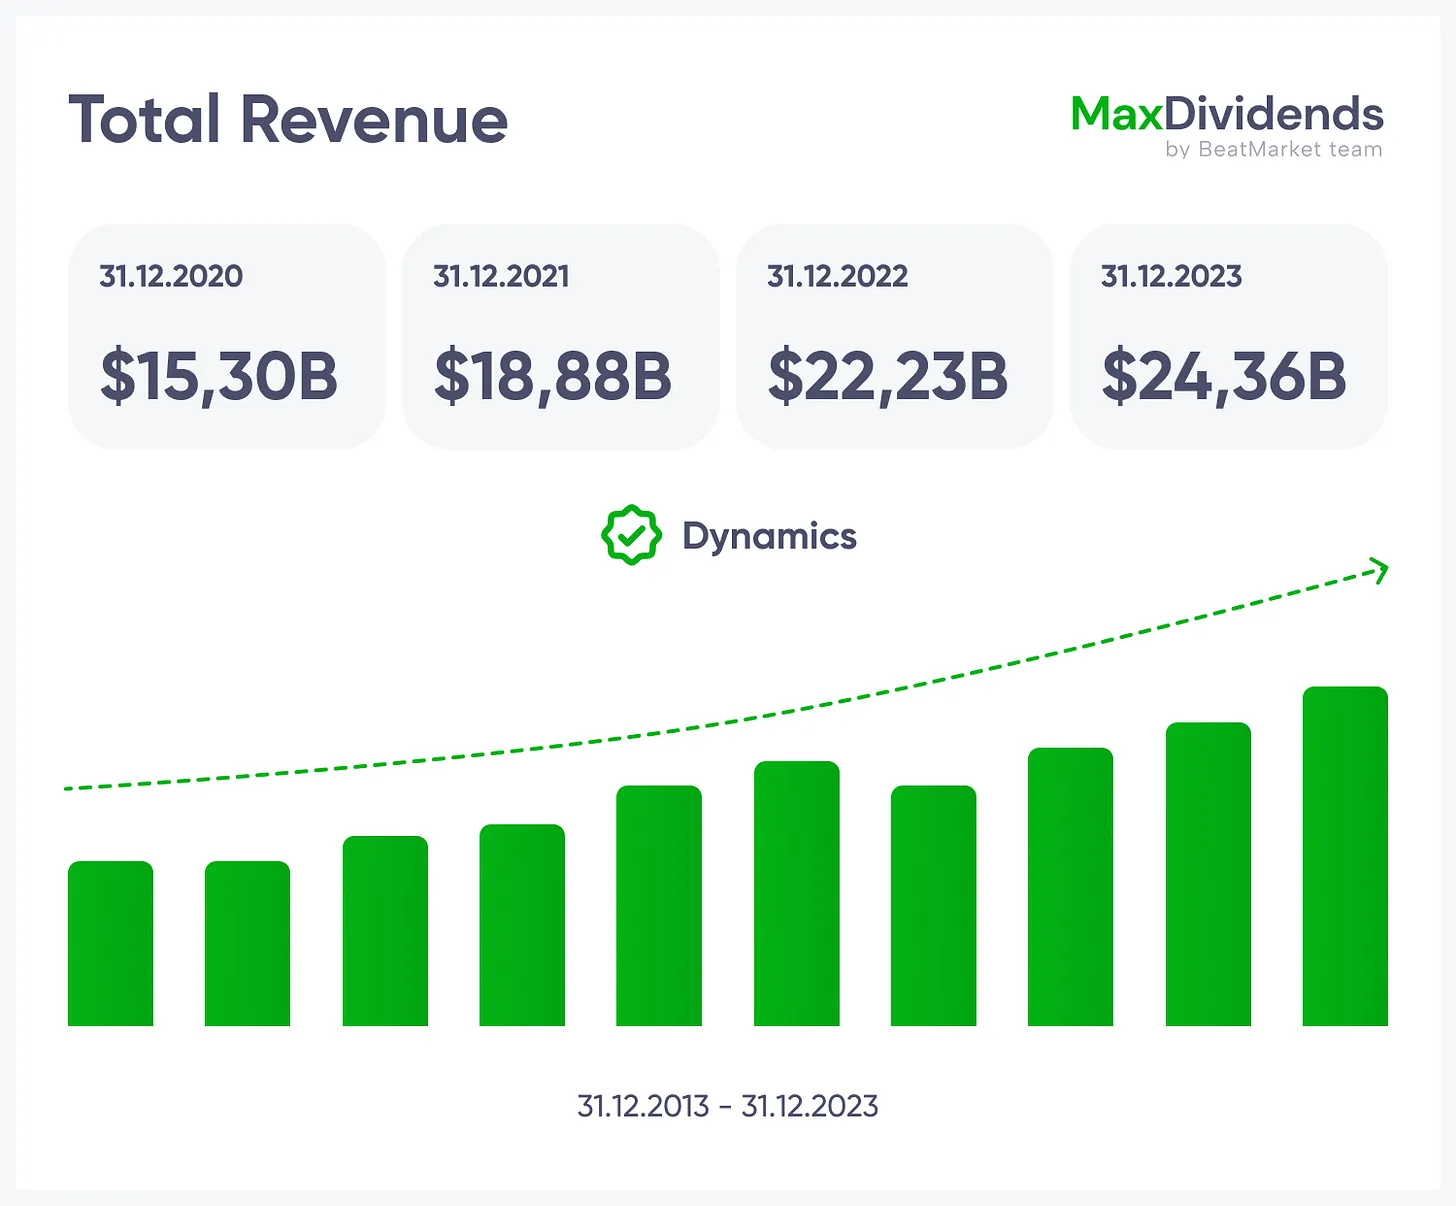
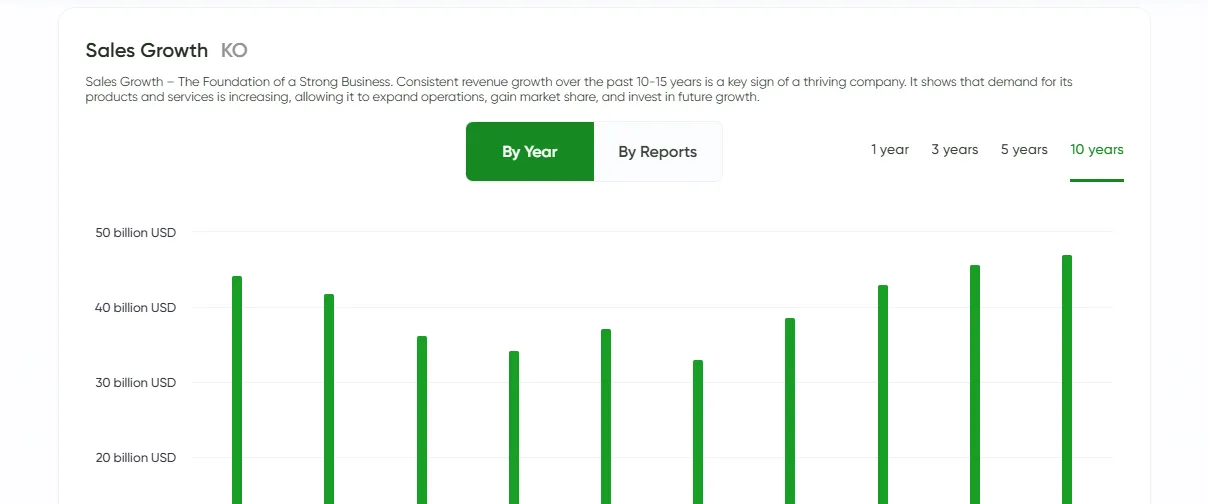 Growth trend, clear in one glance.
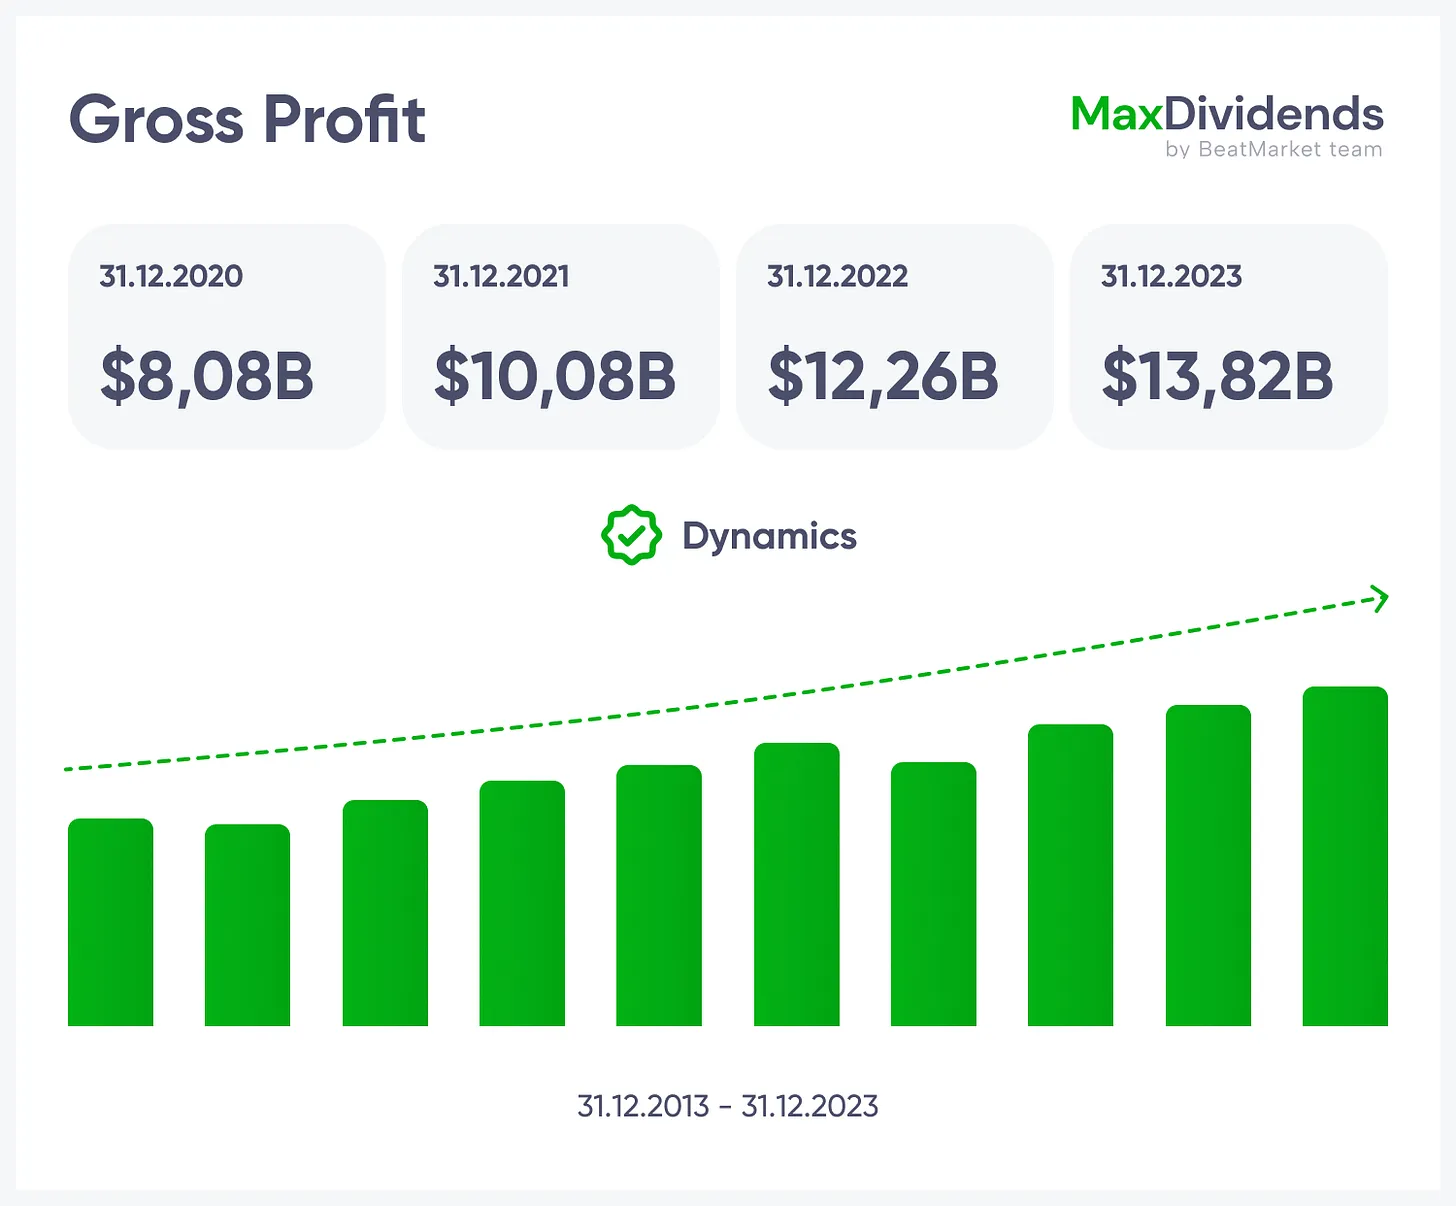
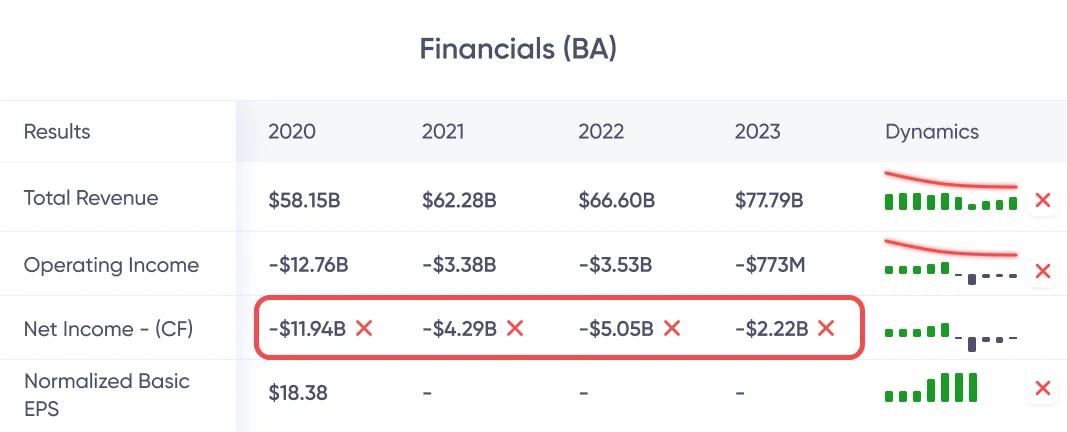
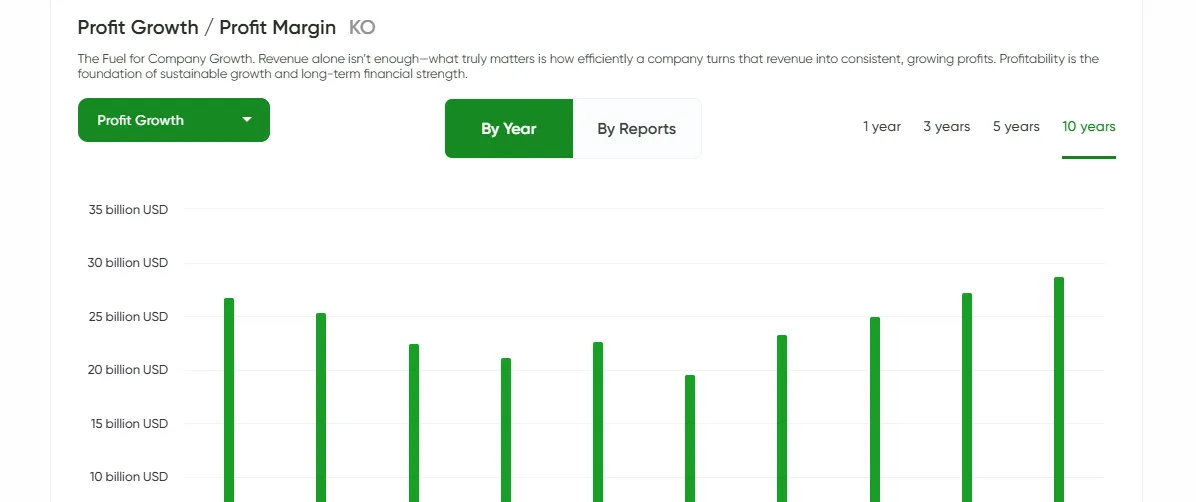 See if profits are real — instantly.
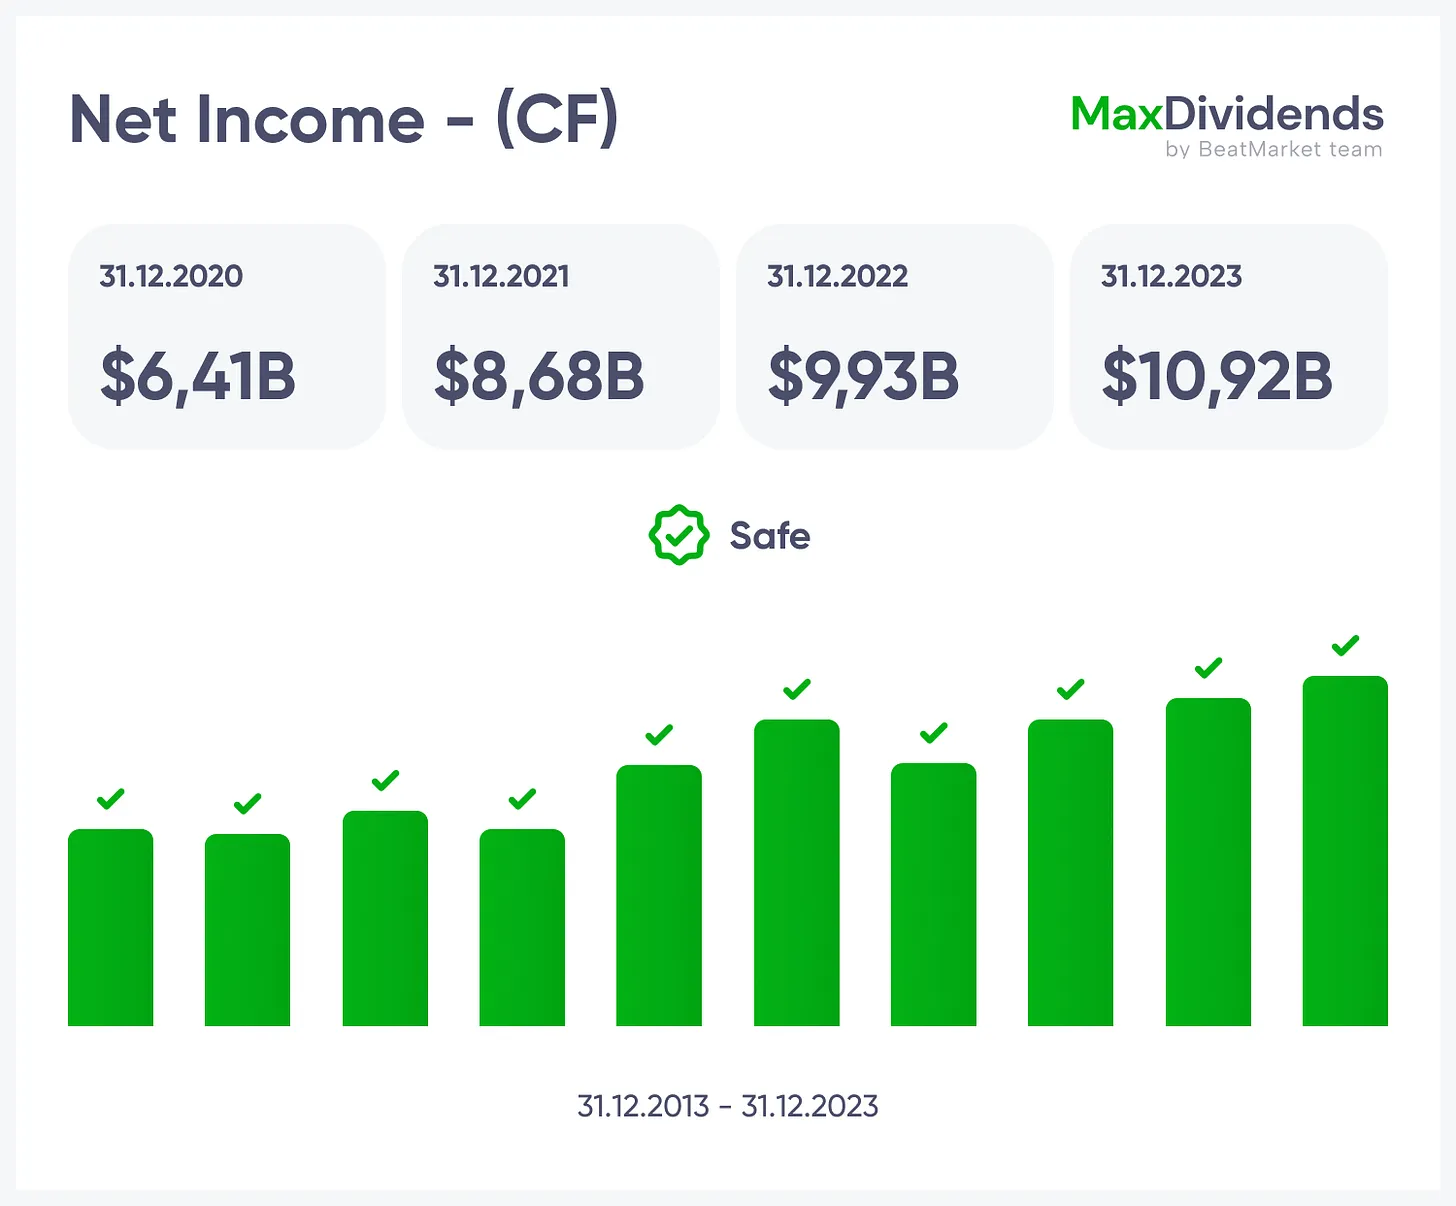
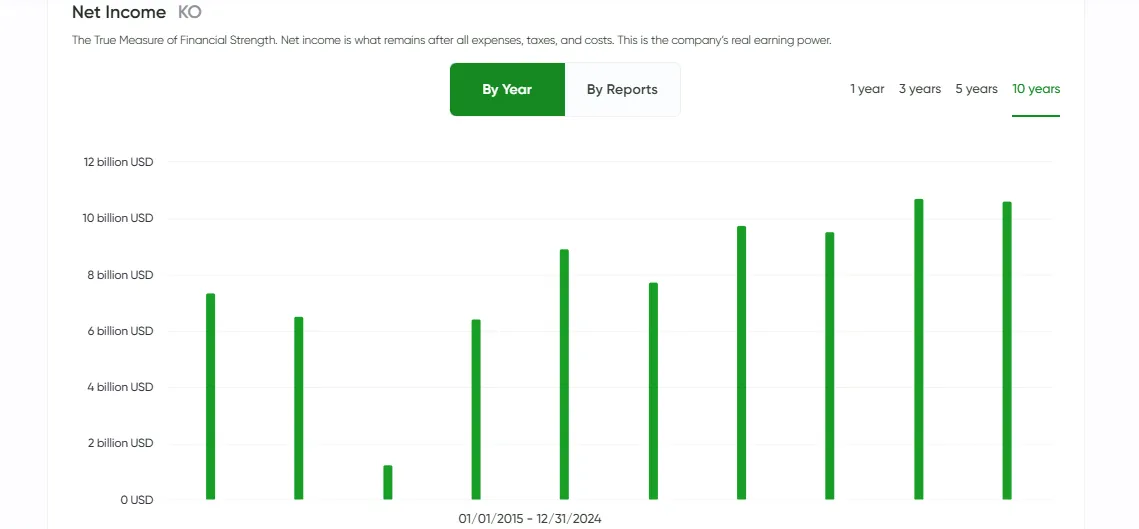 Bottom line made simple with MaxDividends.
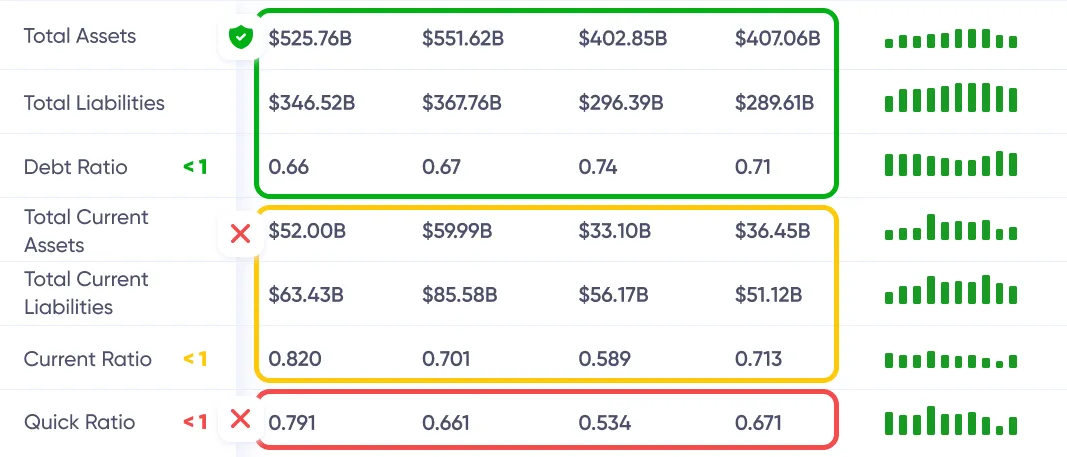
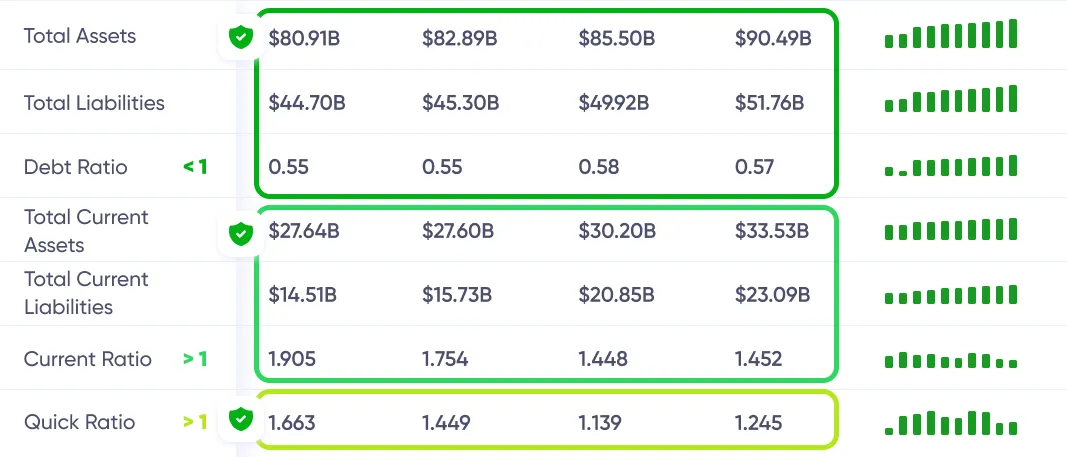
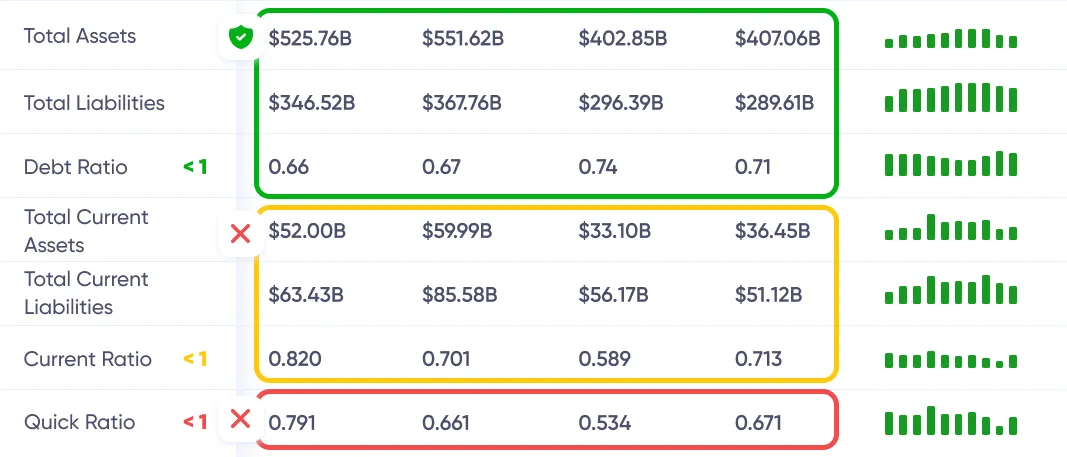
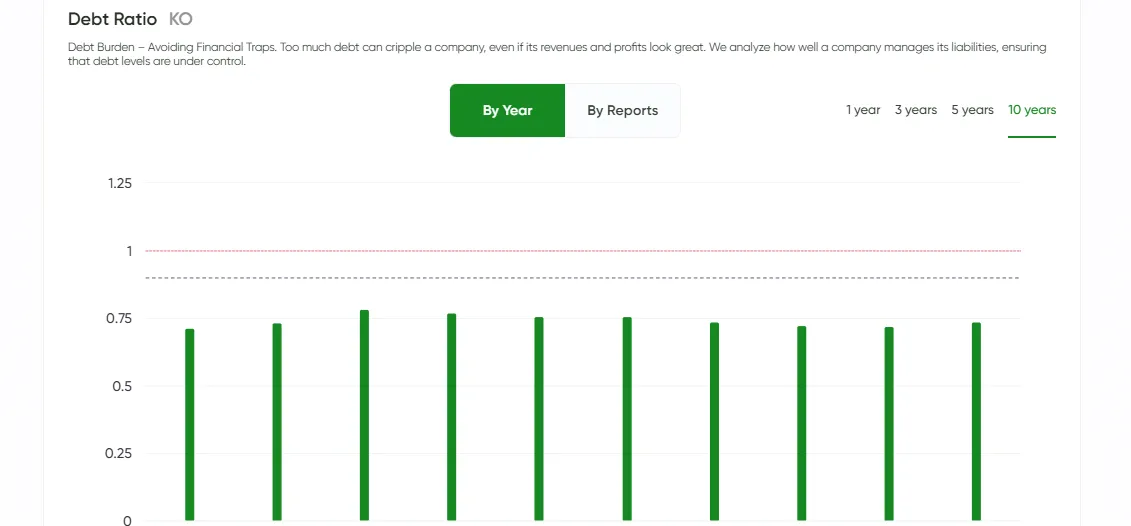 Debt risk checked for you, 24/7.
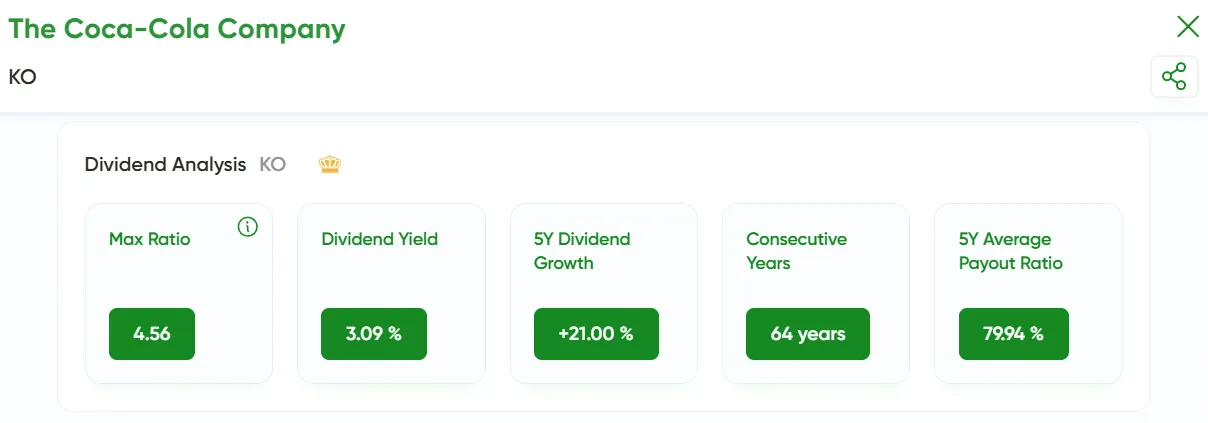
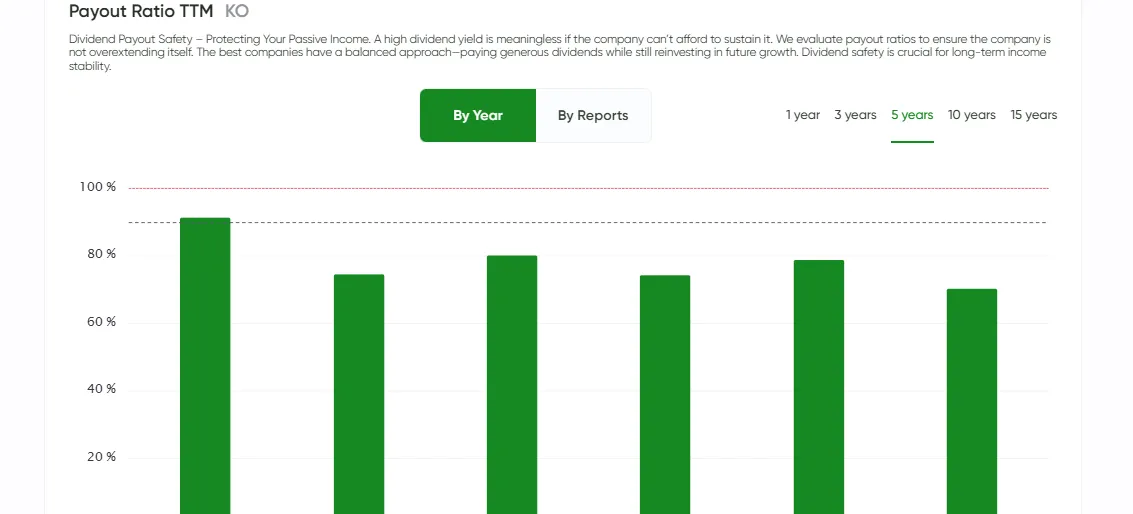 Dividend streaks and raises at your fingertips.
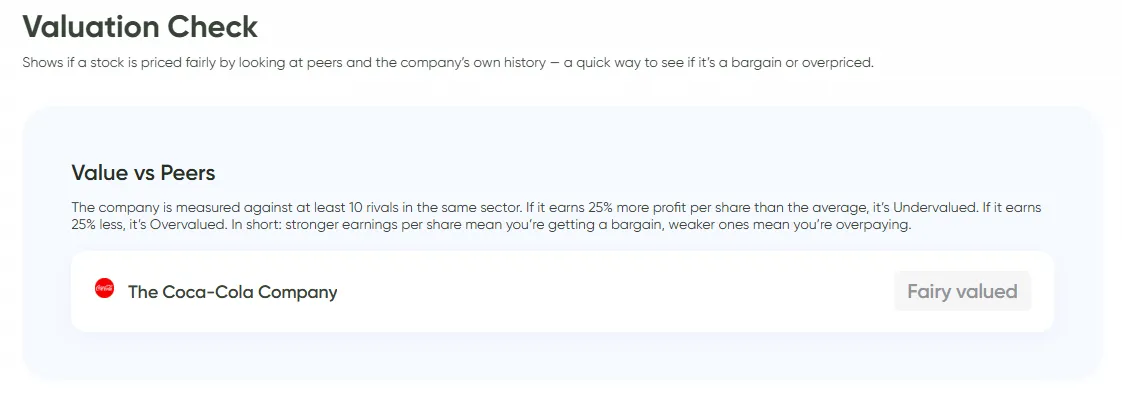 Stack the company against rivals. If it earns more per share, it's undervalued. If less, overpriced.
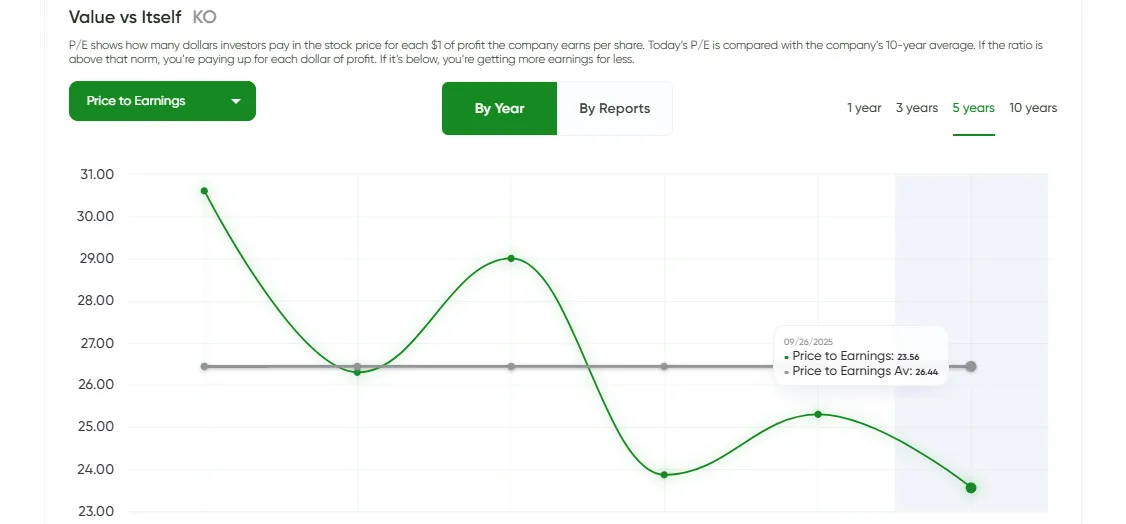 Compare today's P/E with its own 10-year history. Above average = expensive. Below = bargain.
 See if the stock trades below its assets. That's buying the business with built-in margin of safety.

 BeatStart