

Market Valuation
Kohtuullisesti arvostettu
Internet Computer
ICP
Bitcoin Cash
BCH
Litecoin
LTC
Kirjoita osake tai kryptovaluutta hakupalkkiin saadaksesi yhteenvedon
Internet Computer
ICP
Bitcoin Cash
BCH
Litecoin
LTC

 Market Valuation
 Consensus
 Best For
Kuinka tämä yritys ansaitsee rahaa
Osinkoanalytiikka GISG
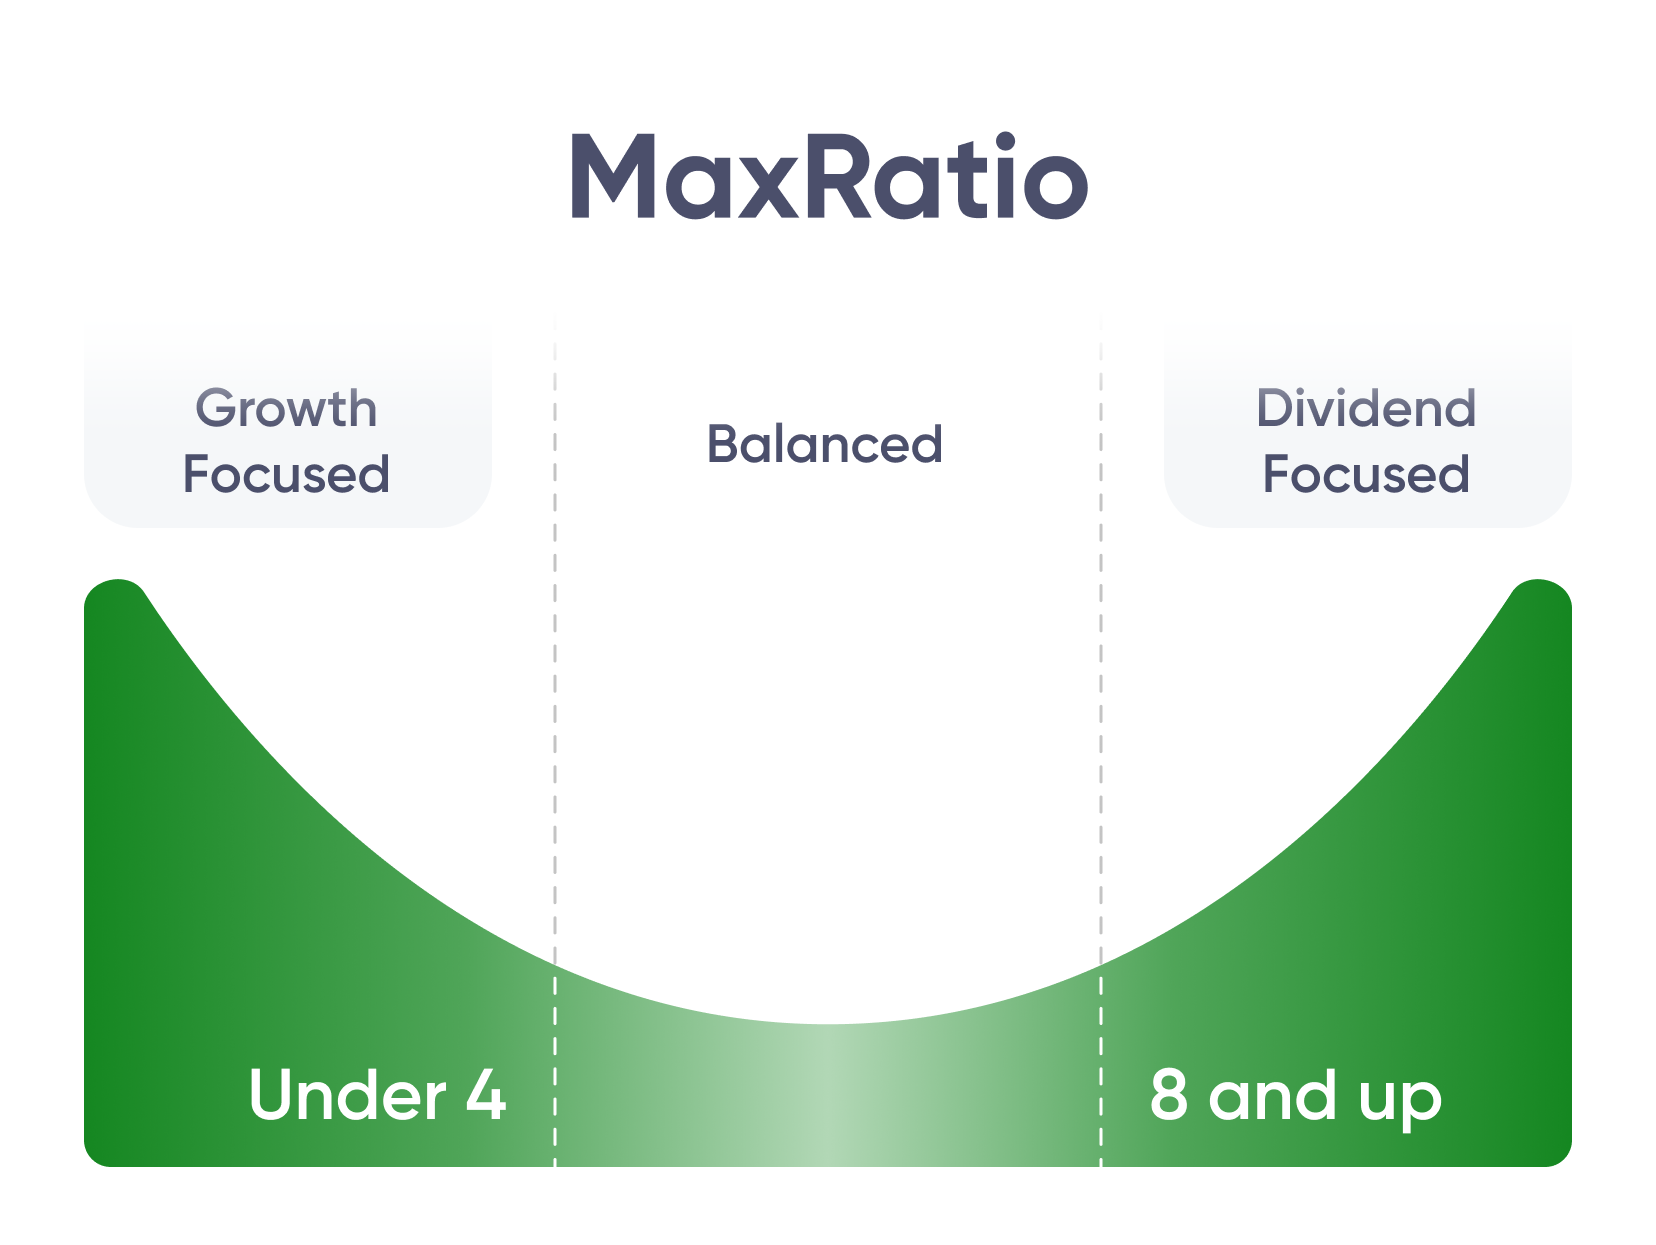
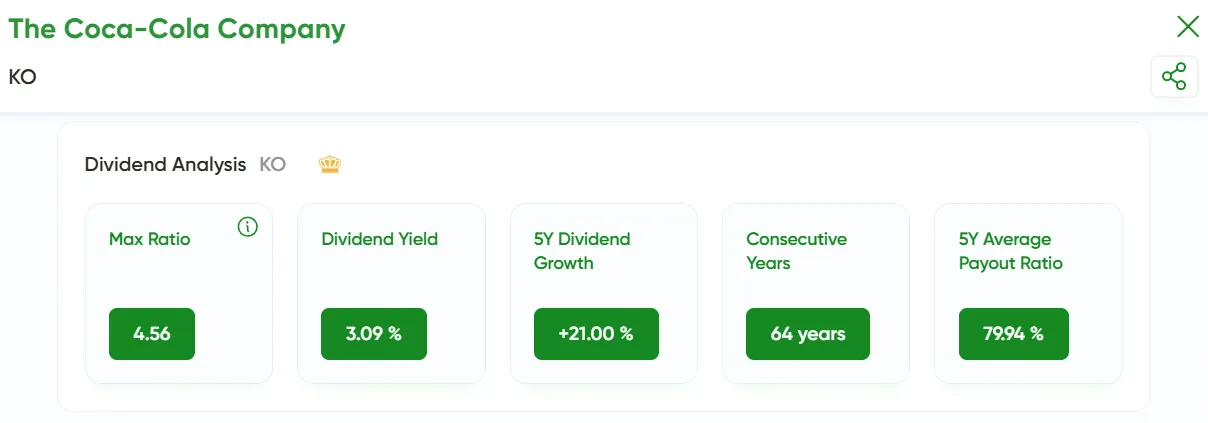
Max Ratio
–Osinkojen kasvu 5 vuoden aikana
0.00 %Jatkuva kasvu
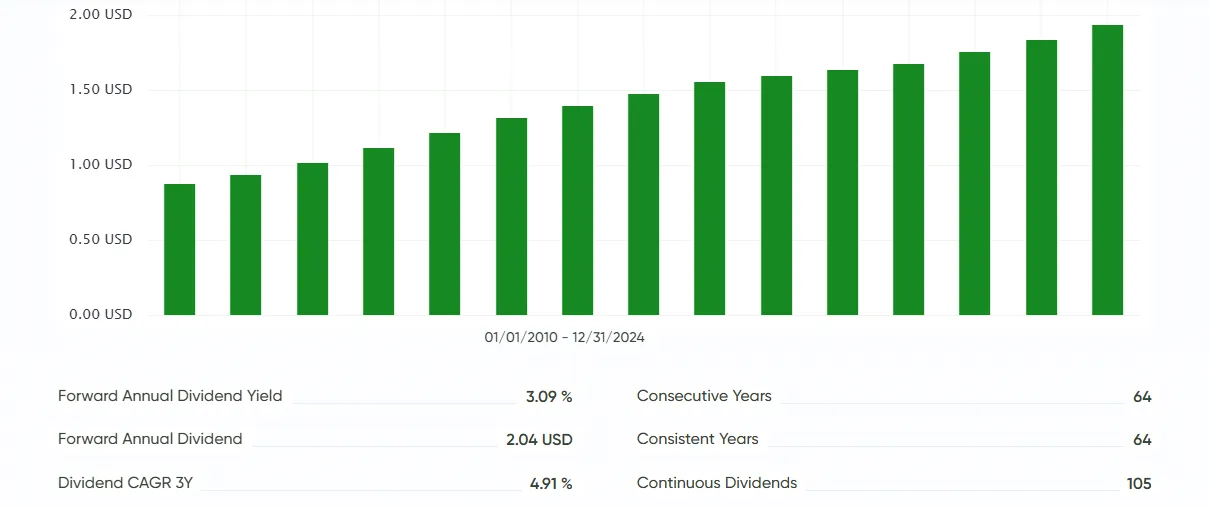
3 vuottaOsinkohistoria GISG
1 vuosi
3 vuotta
5 vuotta
10 vuotta
15 vuotta
11/21/2021 - 11/28/2021


Lyxor Core Global Inflation-Linked 1-10Y Bond (DR) UCITS ETF - Monthly Hedged to GBP - Dist
GISGNykyinen hinta
10.85 GBP
-0.048 GBP (-0.44%)
Yritys
www.amundi.com
ISIN
-
Luokka
Global Inflation-Linked Bond - GBP Hedged
Vaihto
London Exchange
Pääomitus
33 366 322 GBP
Tuotto 12 kuukautta.
-99.00 %
1Y
3Y
5Y
10Y
15Y
GISG
Advanced Highlights
Kokonaisvarat
33 366 322 GBPNettokulujen suhde
–Vuotuinen liikevaihto
–Omaisuuserien hallintaGISG
Käteinen
Pitkät
-
Lyhyet
-
Nettovarallisuus
-
USA:n osakkeet
Pitkät
-
Lyhyet
-
Nettovarallisuus
-
Osakkeet ex-USA
Pitkät
-
Lyhyet
-
Nettovarallisuus
-
Joukkovelkakirjalainat
Pitkät
100%
Lyhyet
-
Nettovarallisuus
100%
Muut
Pitkät
-
Lyhyet
-
Nettovarallisuus
-
Tehokkuus GISG
1v volatiliteetti
1.77%
Tuotto vuoden alusta
1.42%
3v volatiliteetti
2.60%
1v tuotto
1.36%
3v odotettu tuotto
0.00%
3v tuotto
4.00%
3v Sharpe-suhde
-0.10%
5v tuotto
1.73%
10v tuotto
0.00%
Tekniset indikaattorit GISG
52 viikon ajalta
7.98 GBP
8.43 GBP
50 päivän MA
8.30 GBP
200 päivän MA
8.27 GBP












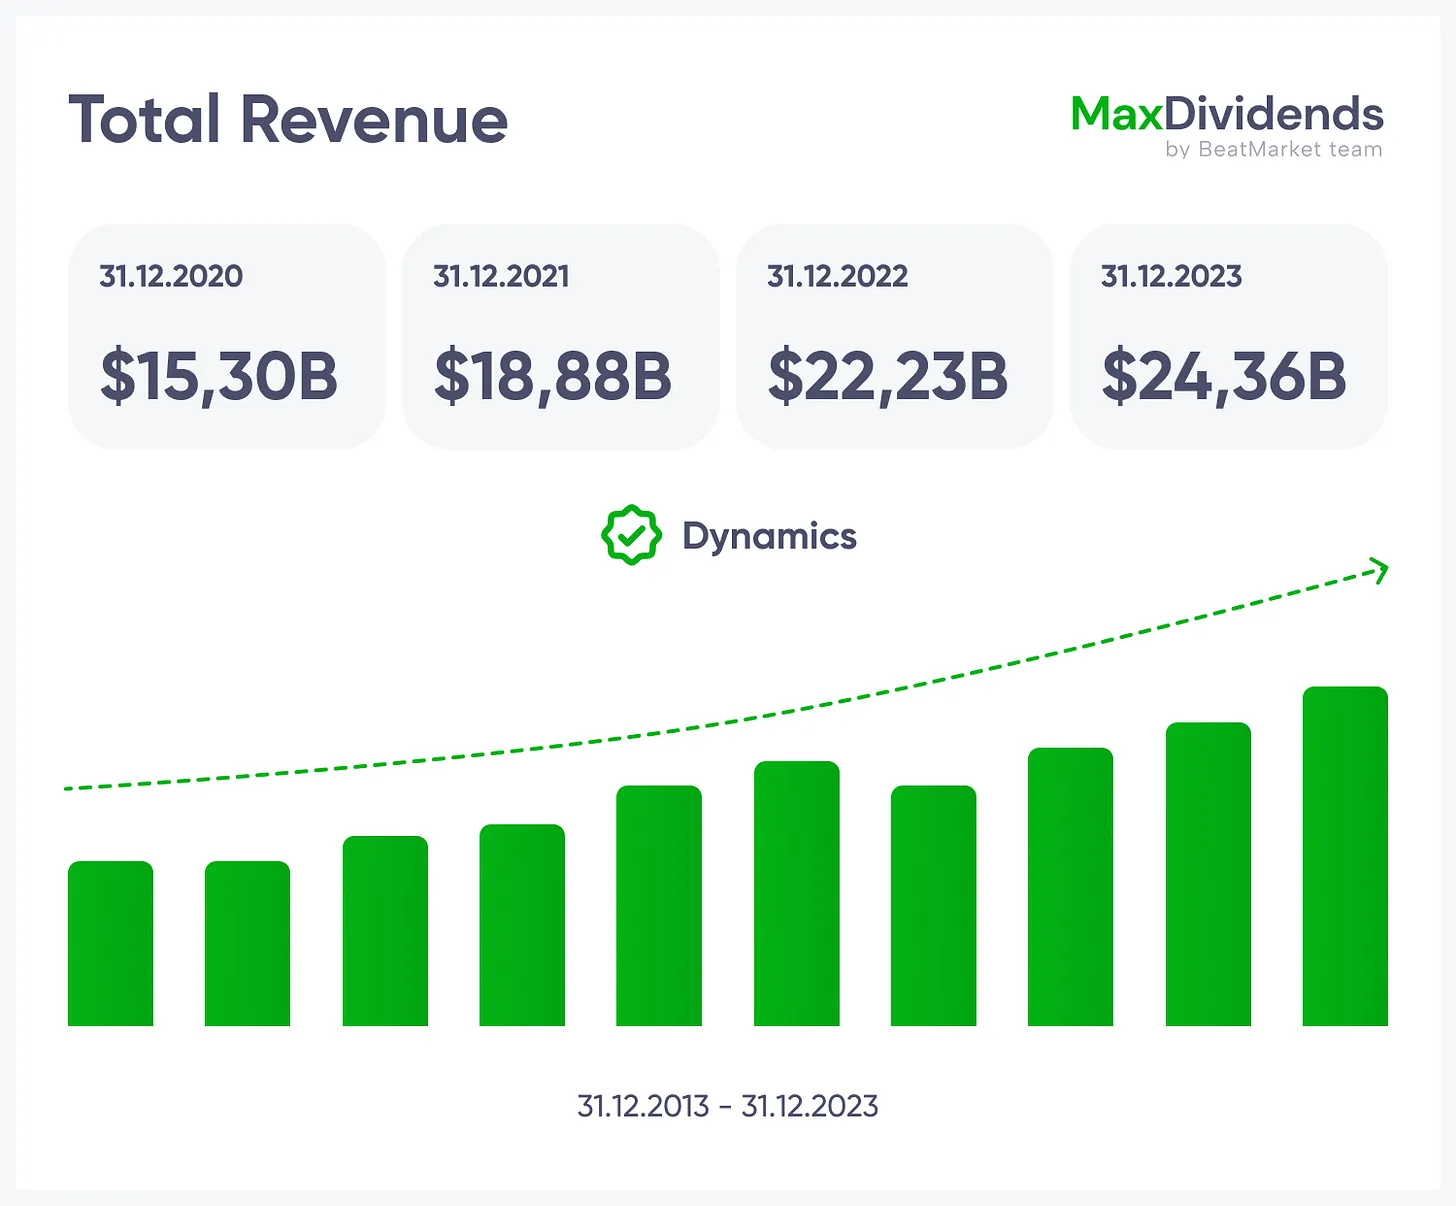
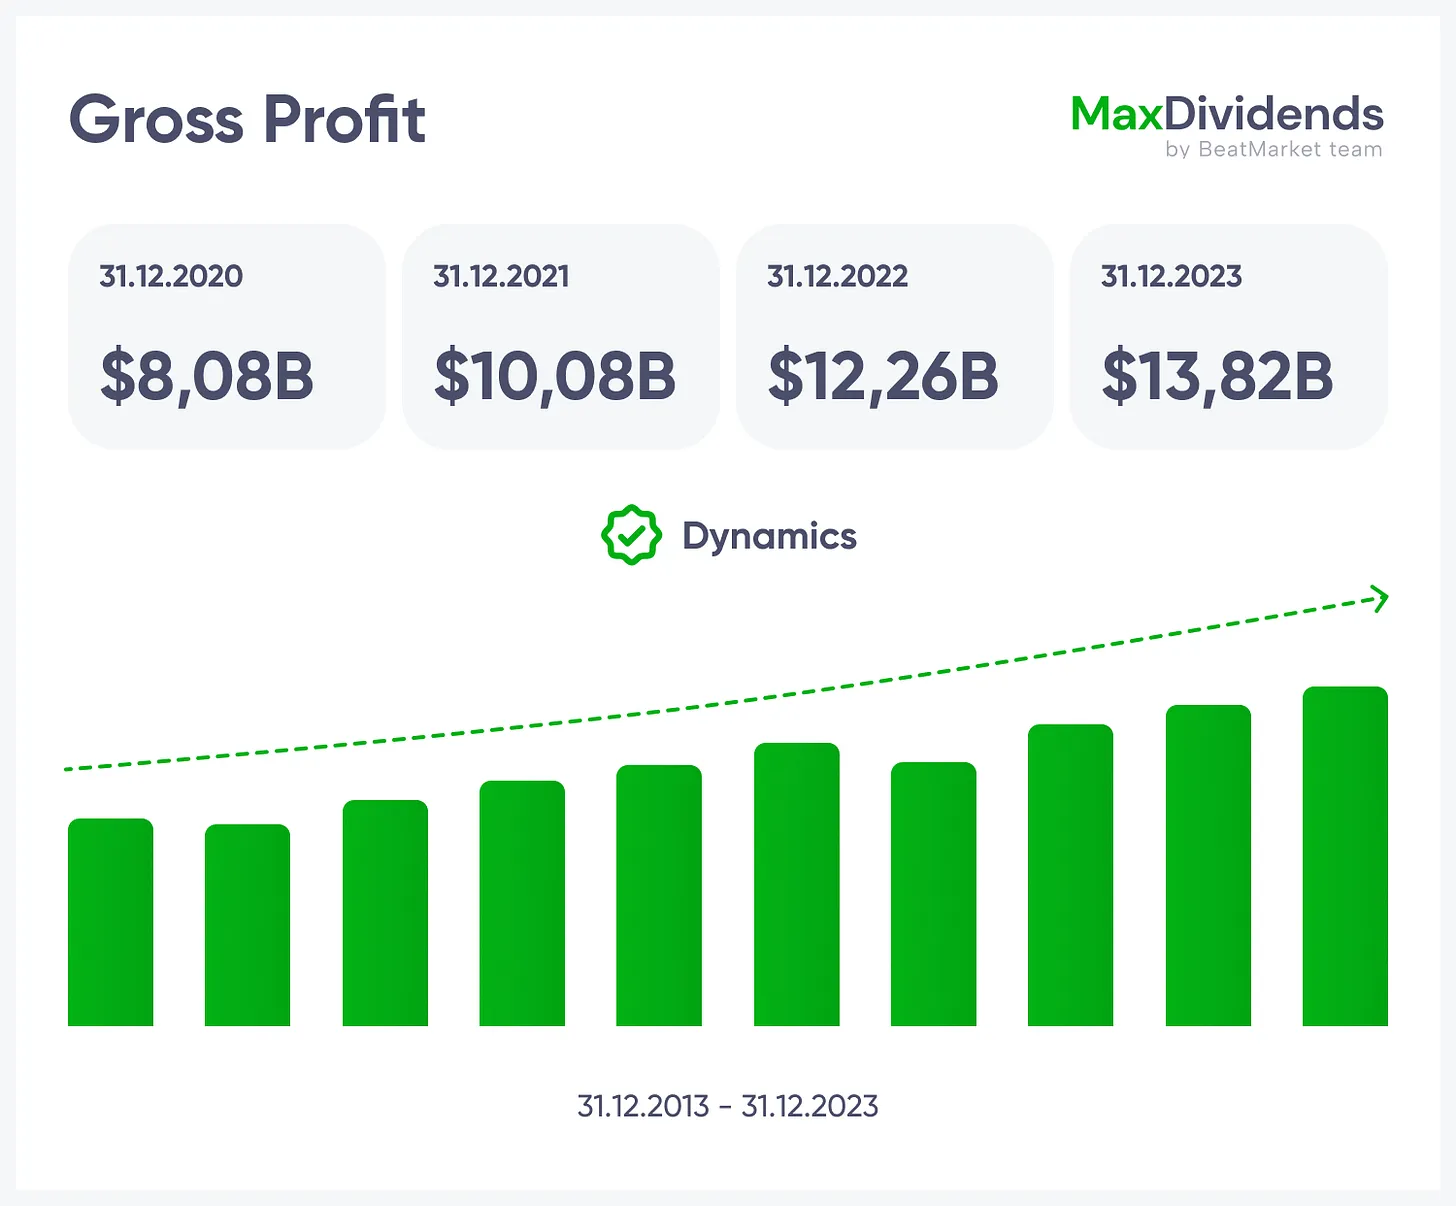
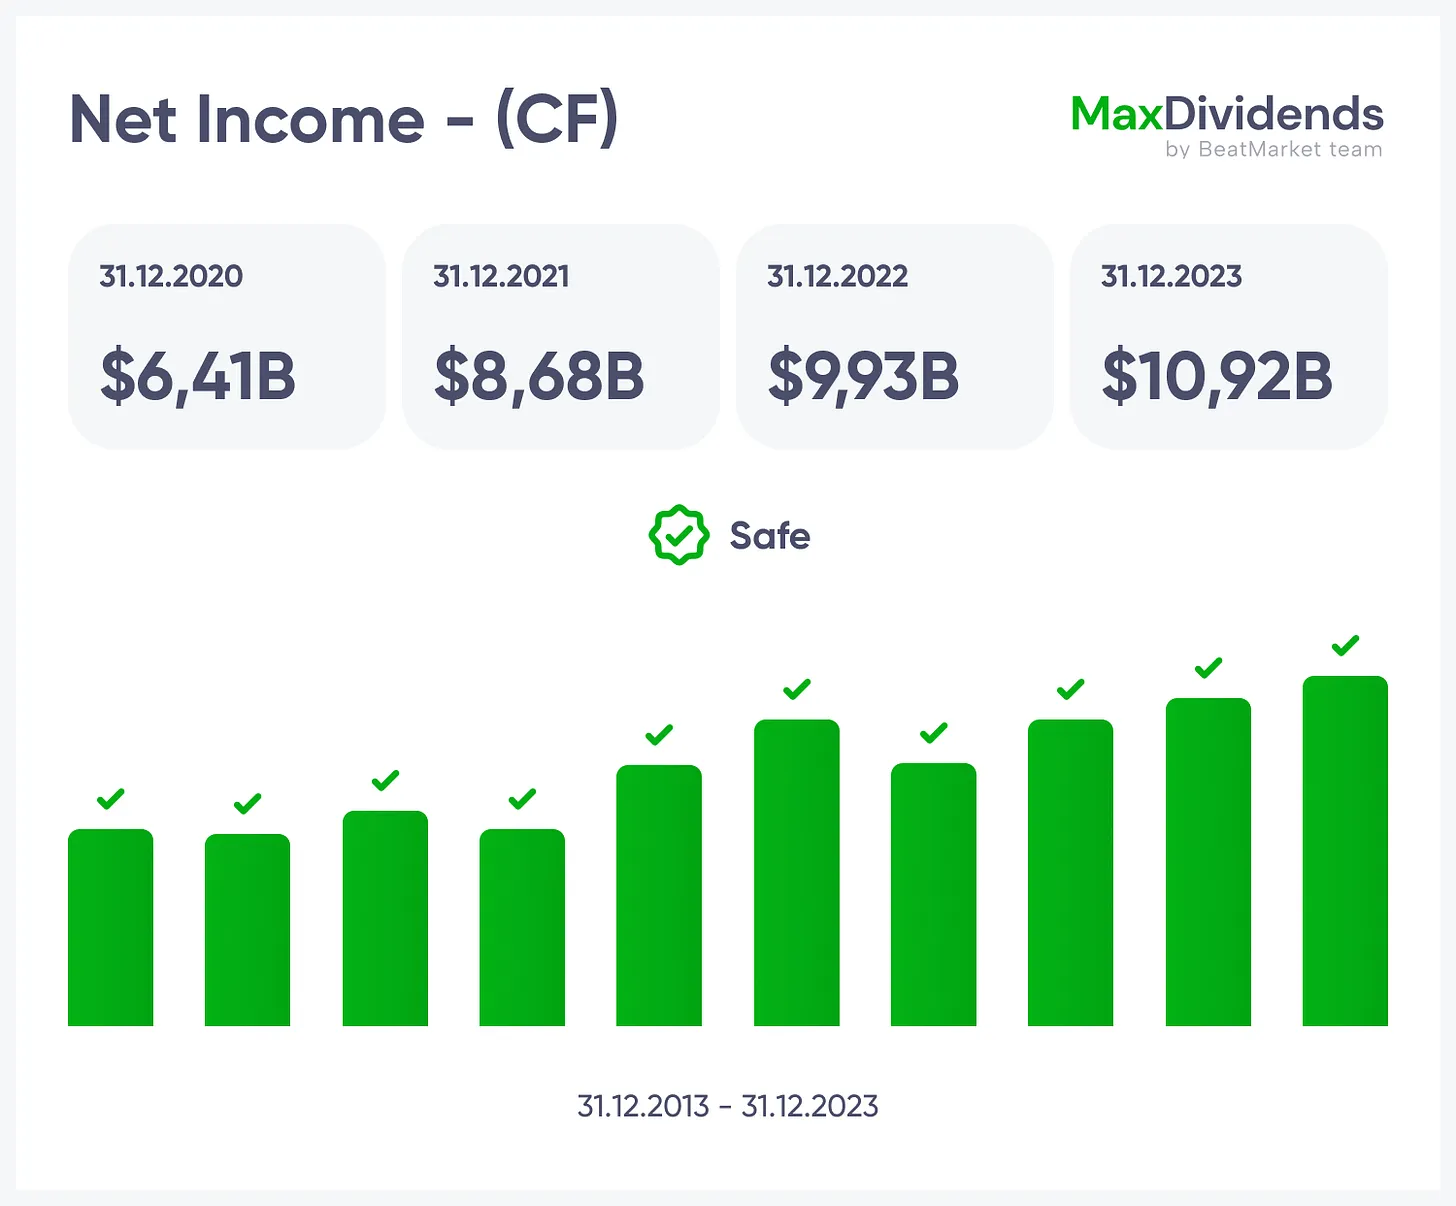
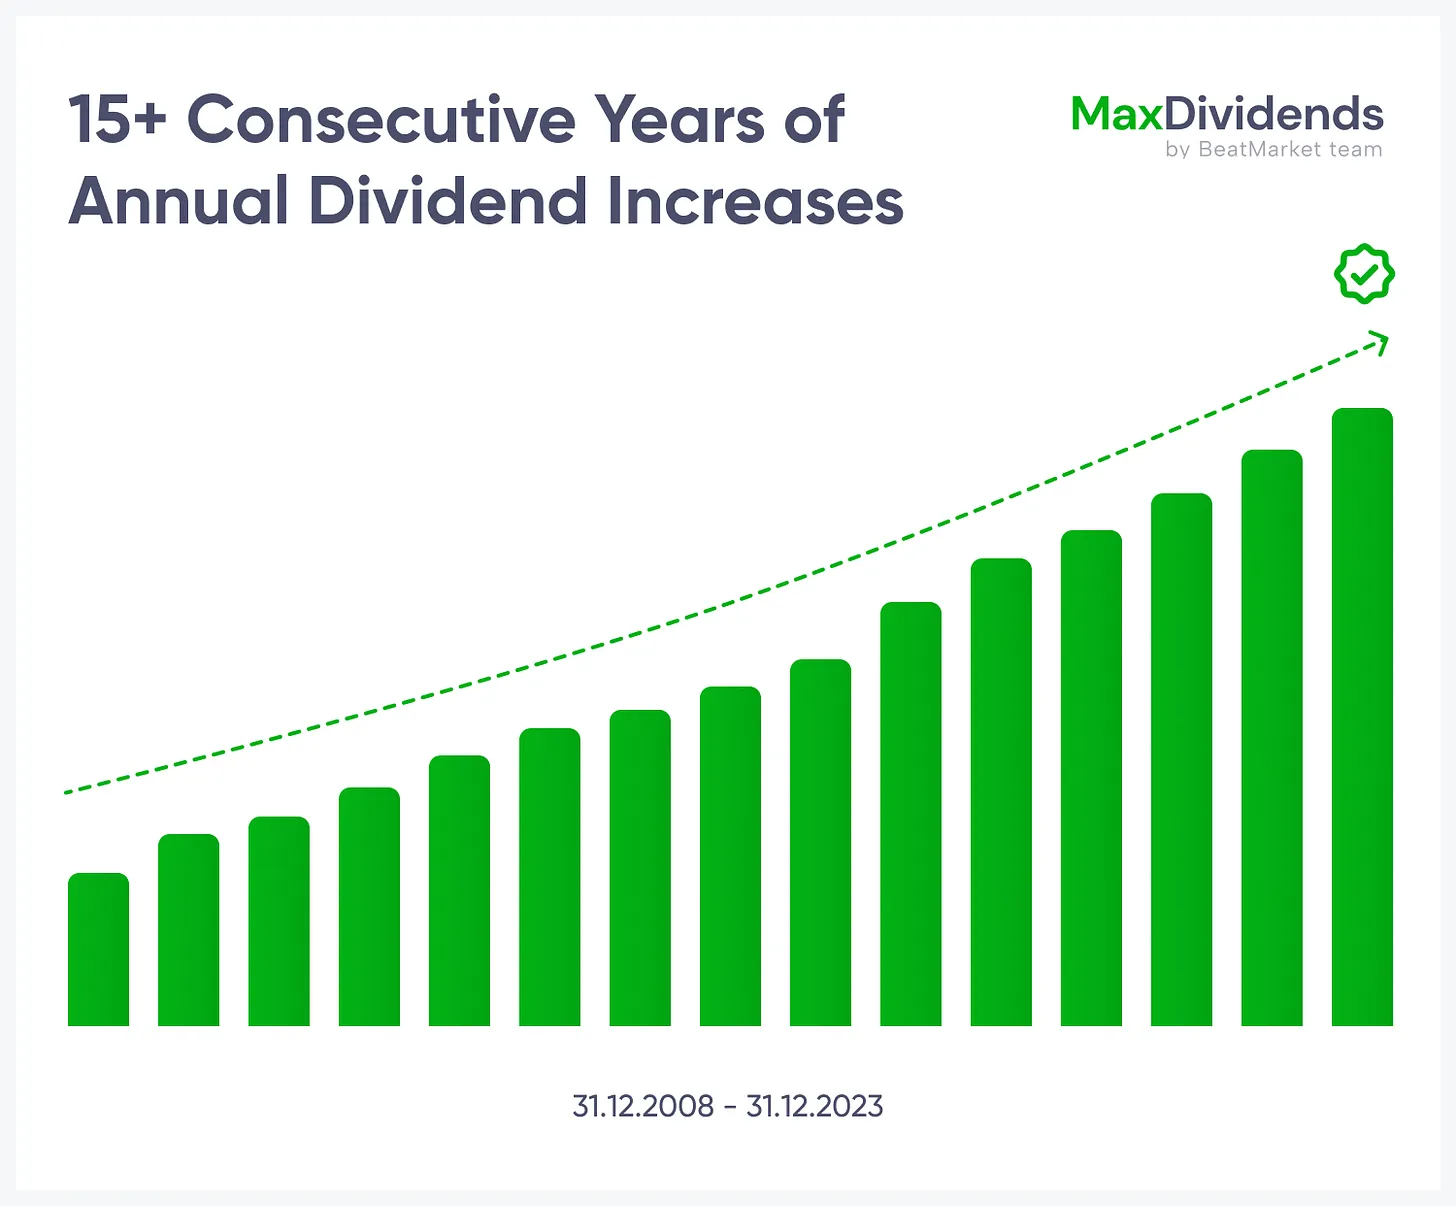
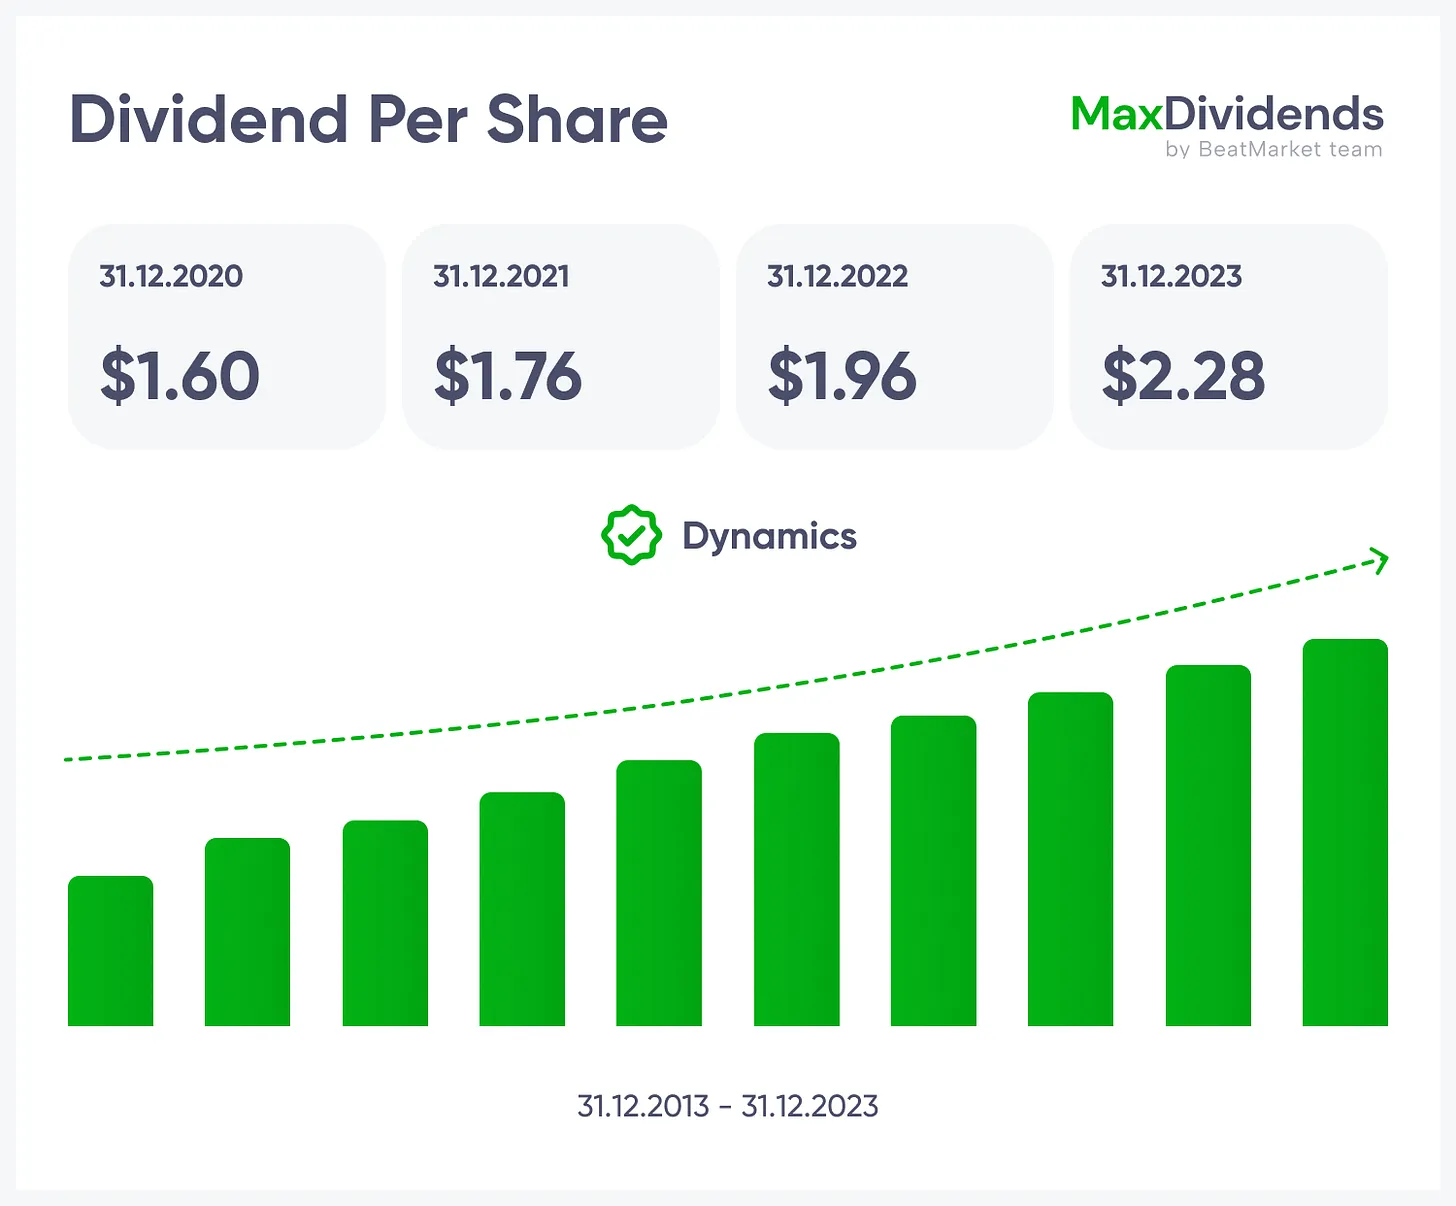
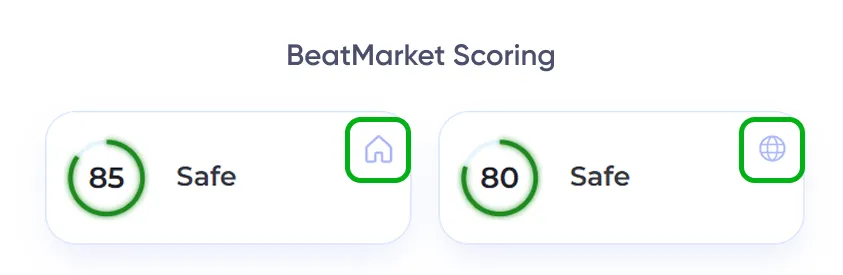
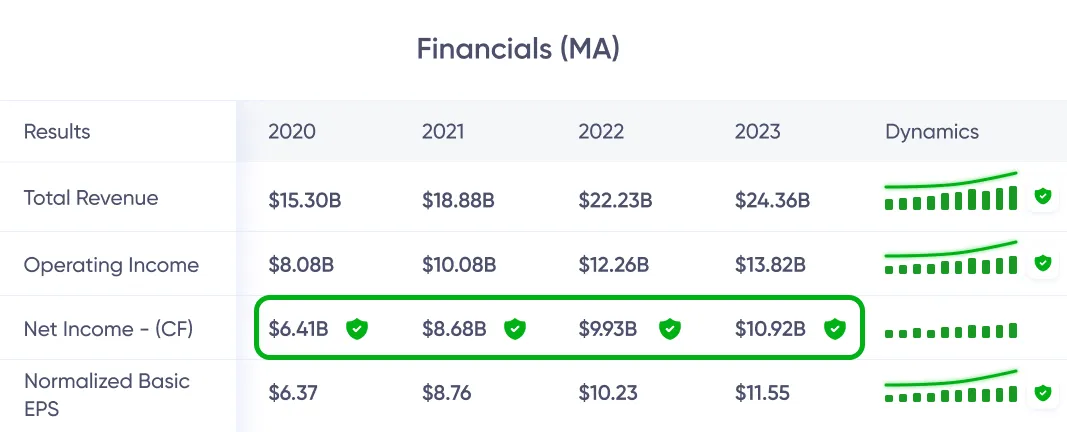
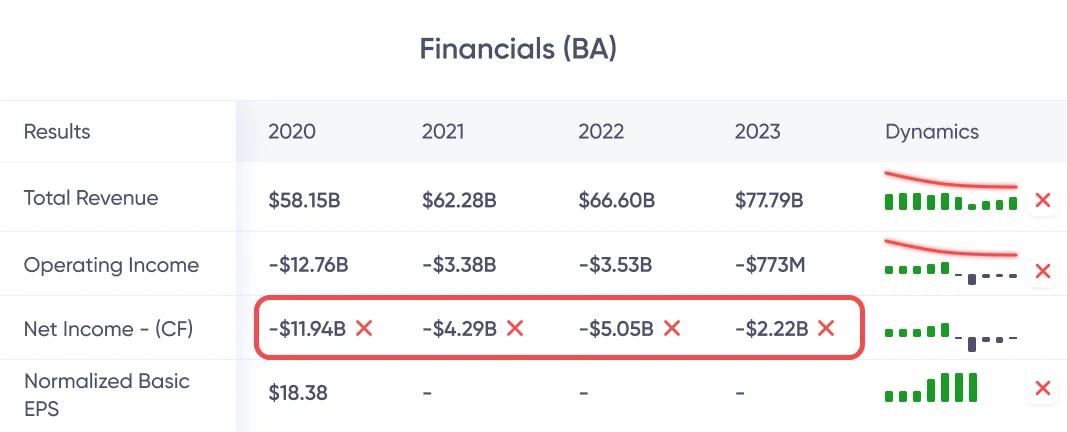


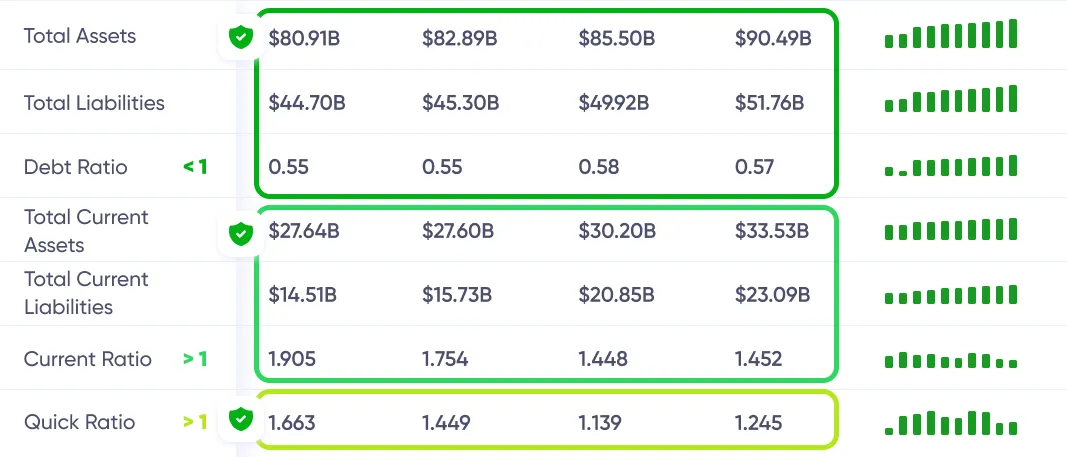
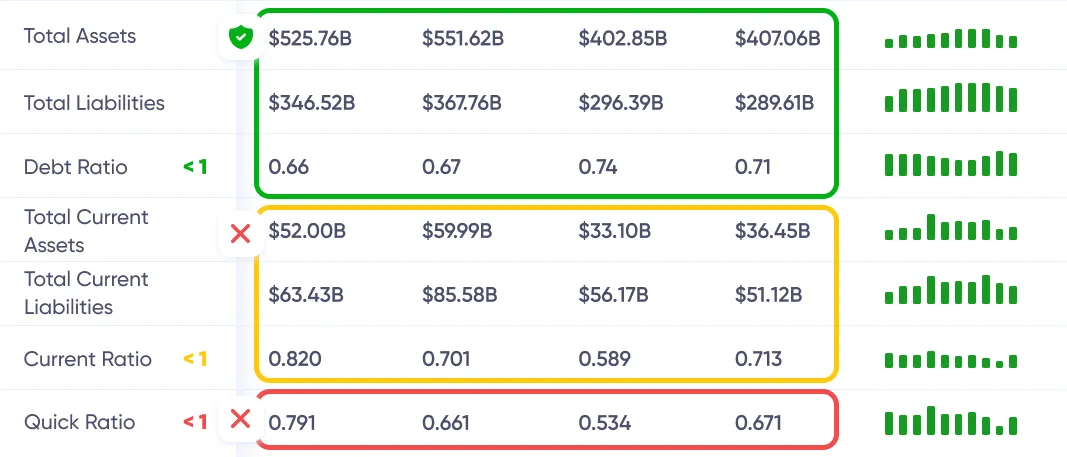

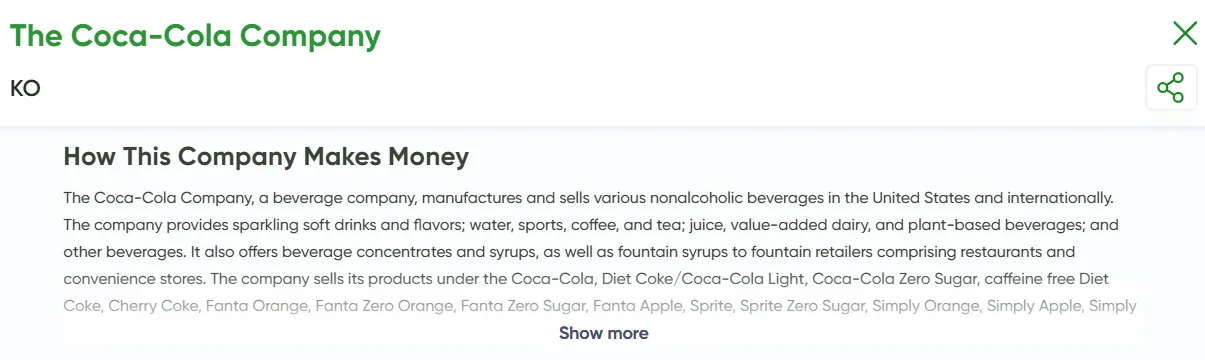 Näe koko liiketoiminta yhdellä silmäyksellä — mitä se tekee, kuinka se ansaitsee ja minkä arvon se tuo.
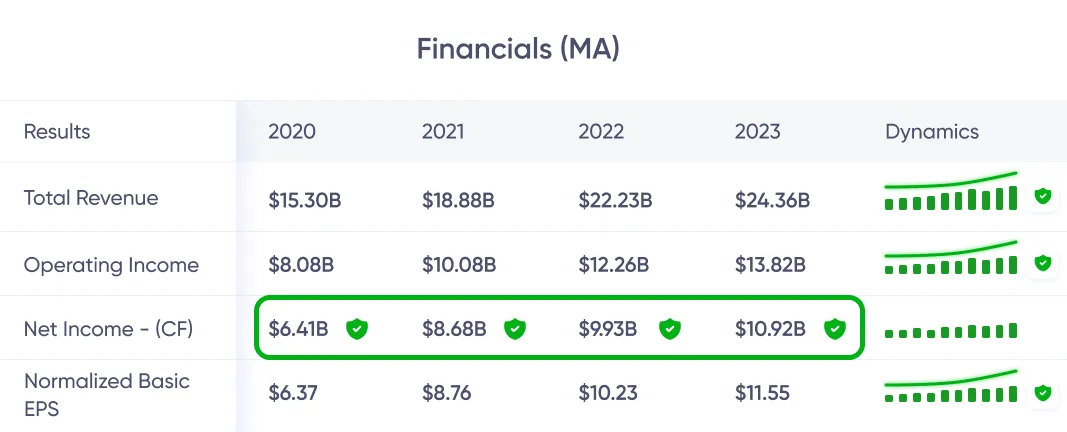
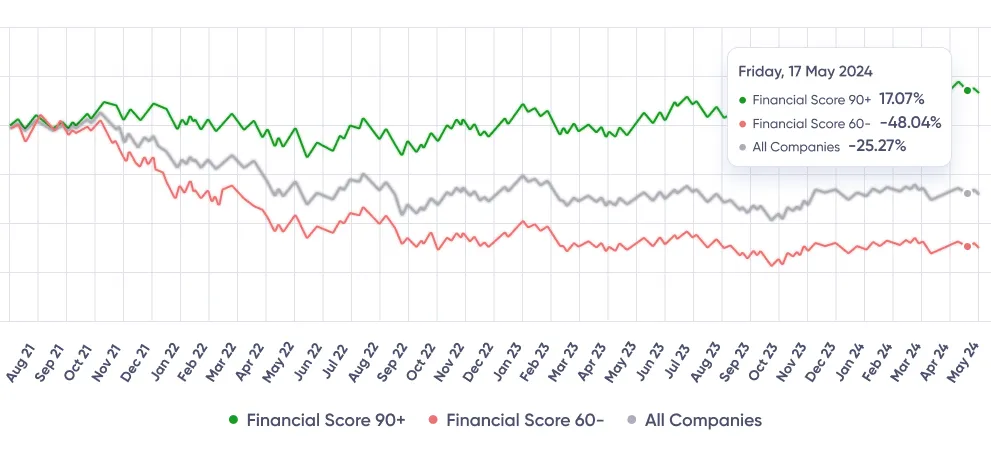
 Kasvutrendi, selvä yhdellä silmäyksellä.
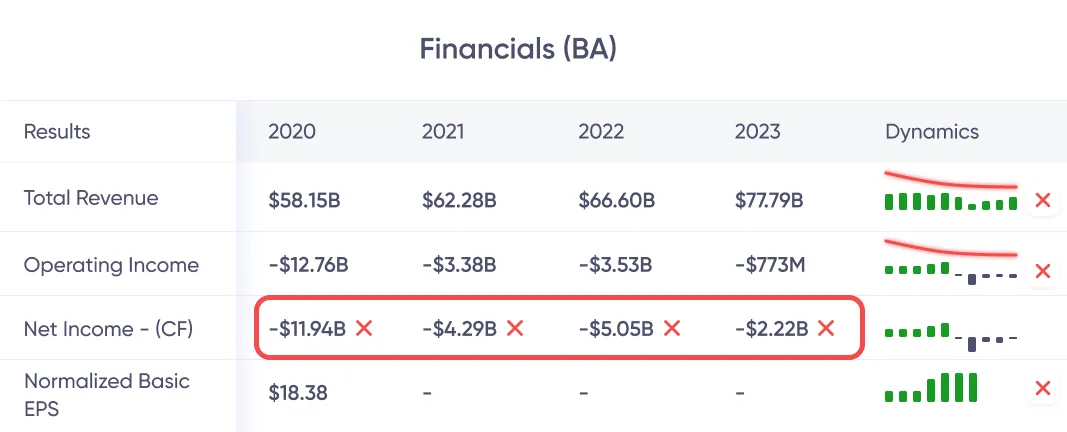
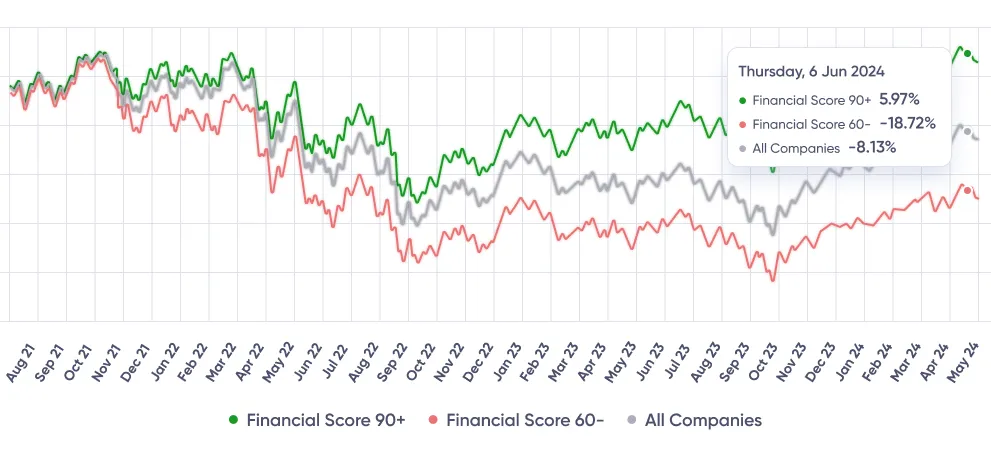
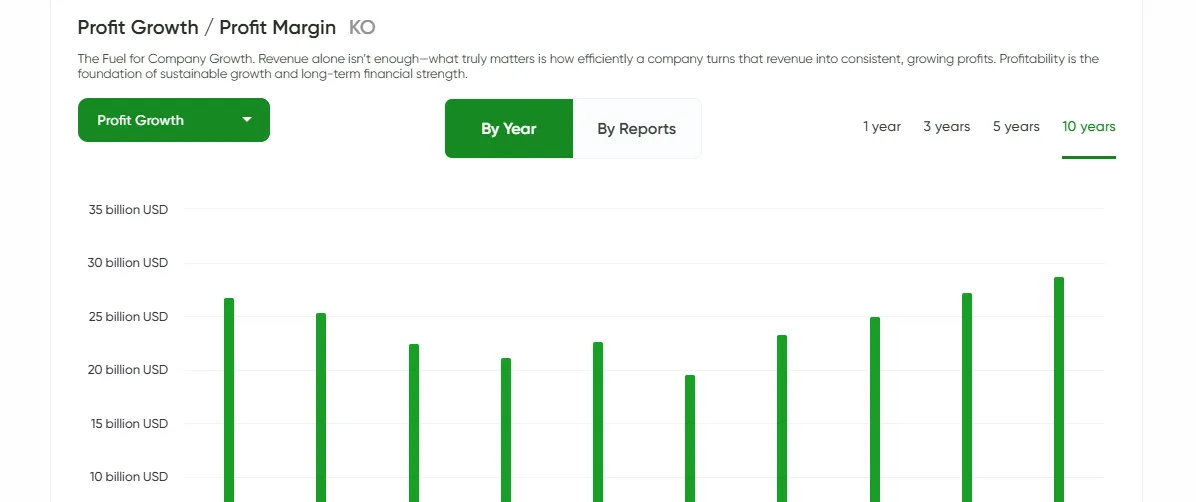 Näe, ovatko tulokset todellisia — välittömästi.
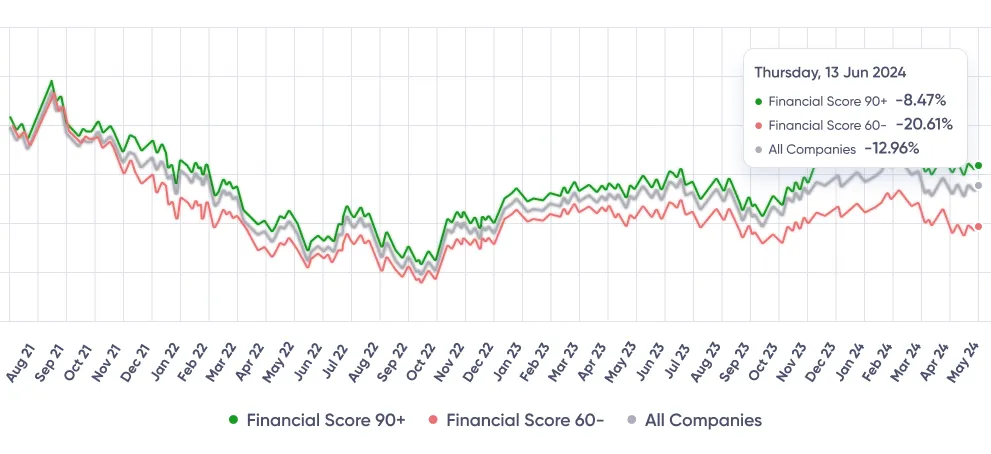
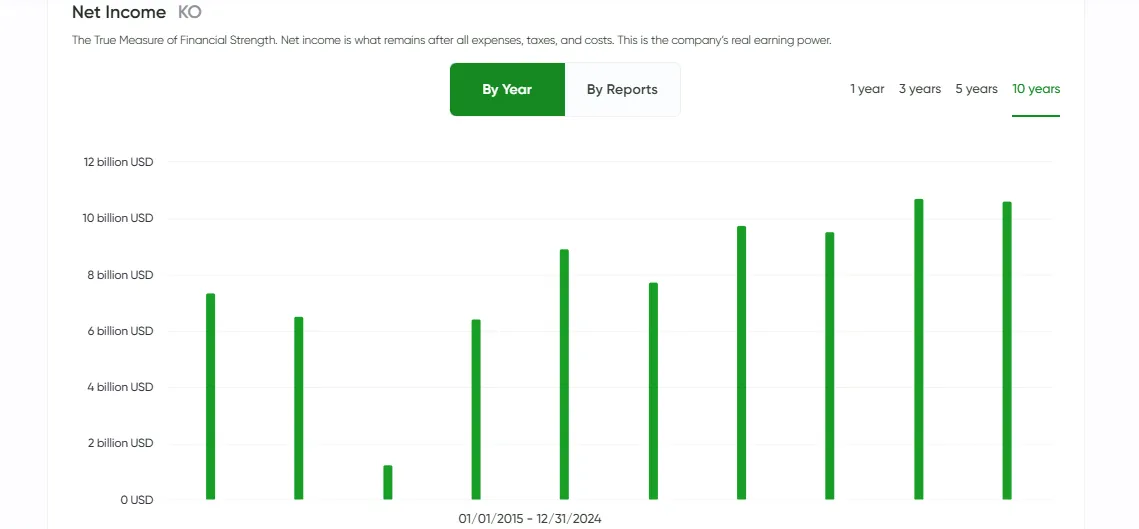 Bottom line tehty yksinkertaiseksi MaxDividendsillä.
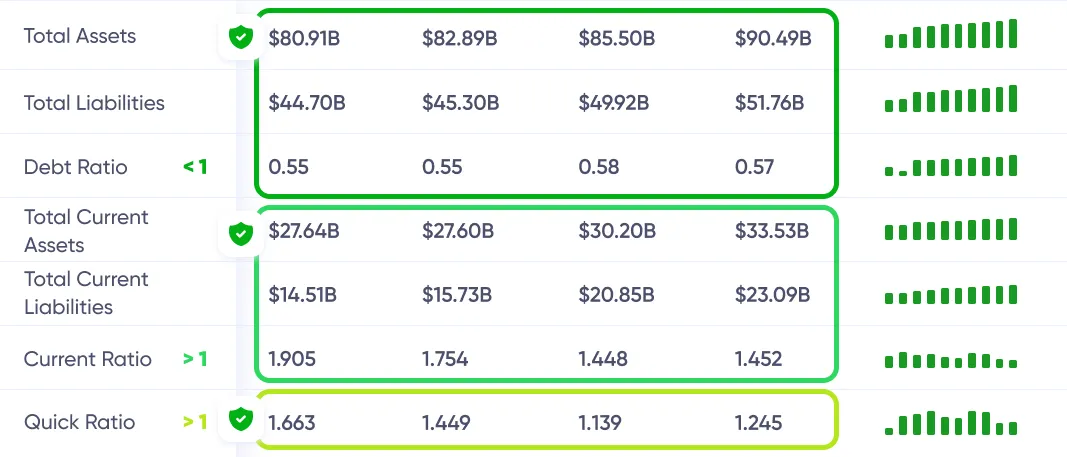
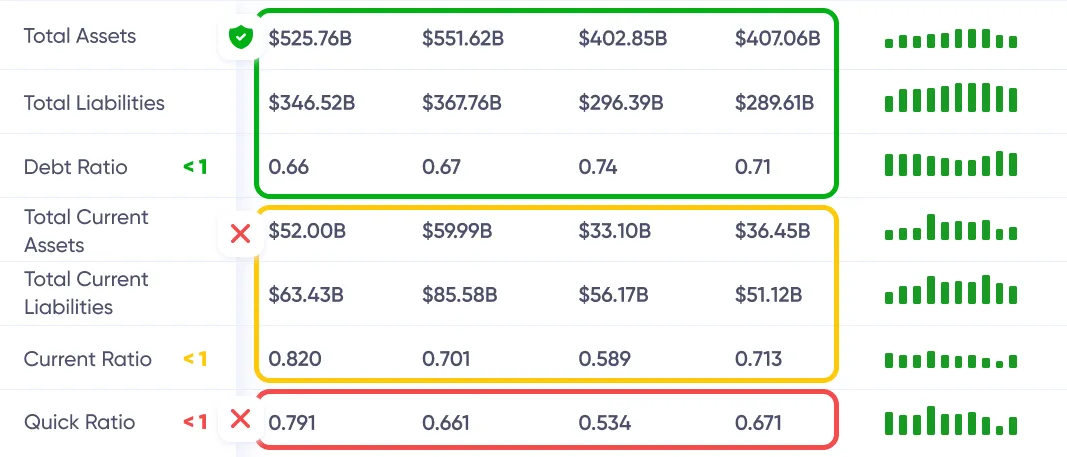
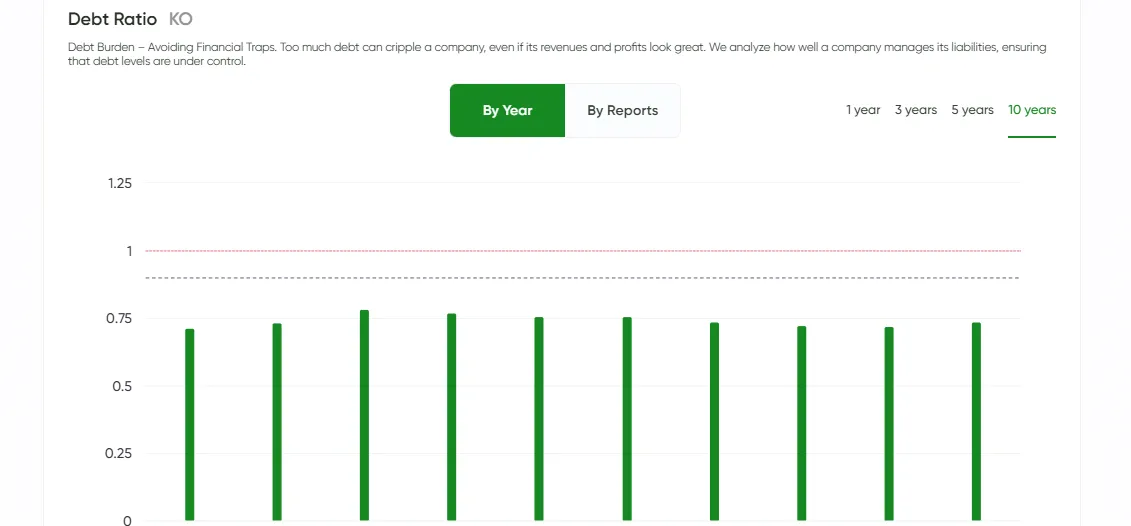 Velkariski tarkistettu puolestasi, 24/7.
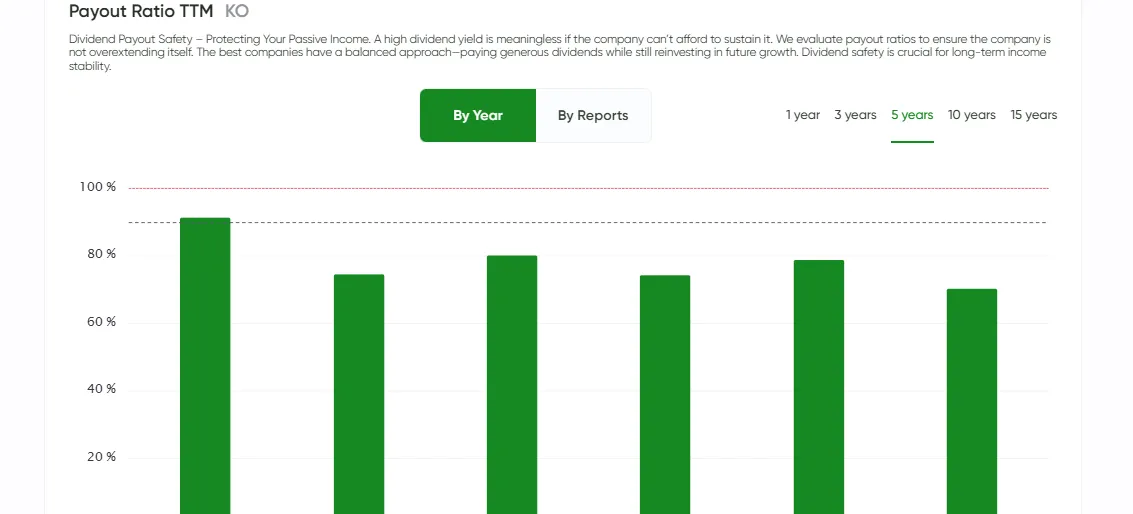 Osinkoputket ja -korotukset käytettävissäsi.
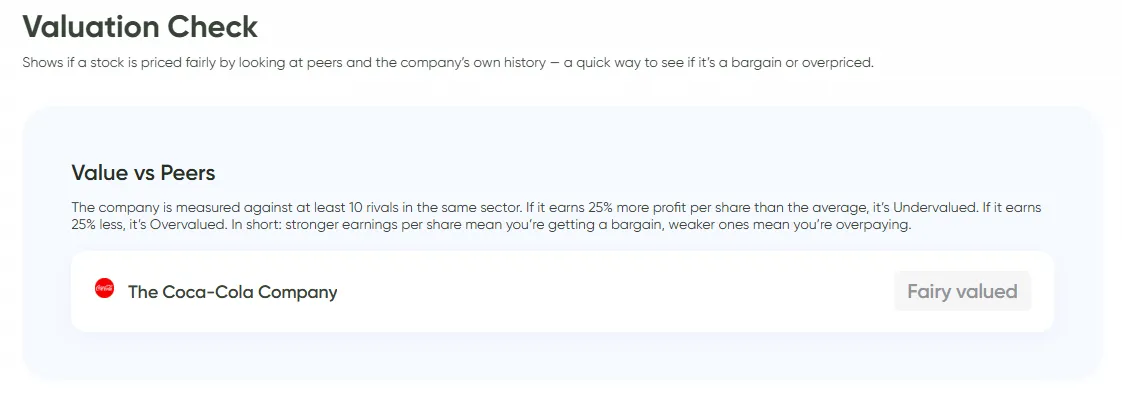 Stack the company against rivals. If it earns more per share, it's undervalued. If less, overpriced.
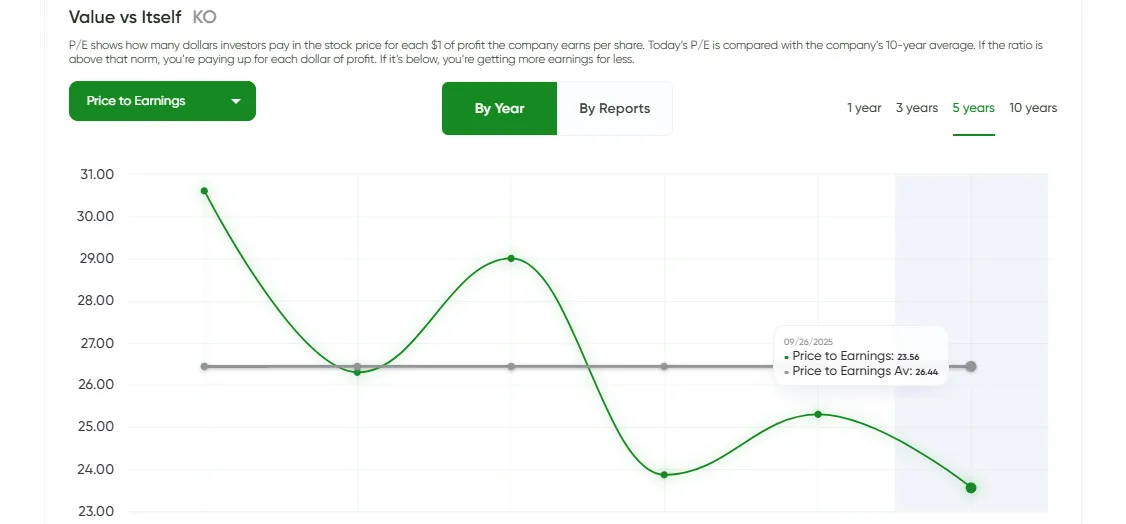 Compare today's P/E with its own 10-year history. Above average = expensive. Below = bargain.
 See if the stock trades below its assets. That's buying the business with built-in margin of safety.

 BeatStart