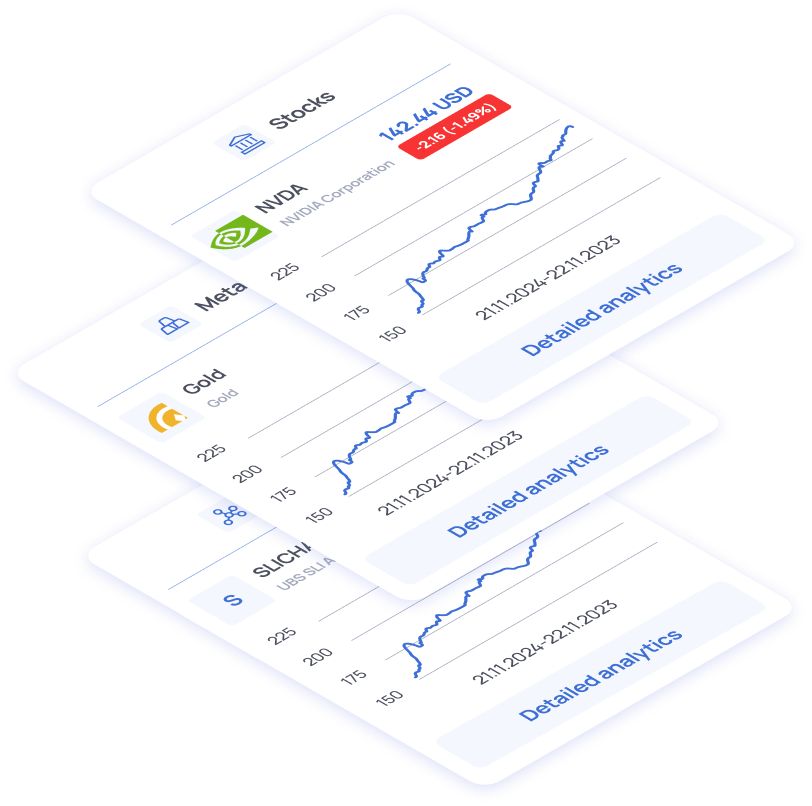
Financial Charts
Track the price dynamics of different companies over different time periods
Using these charts you will be able to predict the future dynamics of price changes, from the charts you will draw conclusions about the change in the price of a stock over a selected period of time, they can also be very useful for fundamental analysts. You will be able to observe the behavior of a security over various periods of time, understand whether it trades near its highs, lows or between them, as well as the influence of world and industry events on its price.