Before we dive in, let me say a few words.
What you’re about to read typically lives inside our Premium section — the highest‑conviction research where we break down, step by step, how to find durable dividend compounders, filter out “headline yield” traps, and build an income stream that can hold up through messy markets.
This is process‑driven, cycle‑tested investing. Not a one‑off idea for the next quarter, but a repeatable framework designed to work through recessions, rate shocks, inflation waves, and shifting market leadership. Today you’re getting a full taste of that approach. In future issues, we’ll share exclusive dividend ideas and less obvious opportunities — businesses with the operating DNA to become tomorrow’s long‑term dividend growers.
The edge is simple: see quality early and act with intention. Instead of chasing performance after a stock is already on everyone’s radar, you position yourself ahead of the crowd — with a clear plan for income, risk, and long‑term compounding.
When you think about essential, regulated utility service — the kind households and businesses can’t realistically “pause” during a downturn — Fortis (FTS) is a textbook name to study. Fortis owns and operates regulated electricity and gas utility assets across North America, built around the unglamorous but powerful economics of rate base, approved capital investment, and predictable returns. It’s infrastructure in the truest sense: keep the lights on, keep energy moving, and earn a regulated return for doing it.
That business model matters for dividend investors. Demand isn’t driven by trends or discretionary spending; it’s tied to essential consumption and regulated service obligations. And because utilities are capital‑intensive, they often follow long planning horizons — multi‑year investment programs that can translate into steady rate‑base growth and, in turn, the capacity to support growing dividends over time.
Fortis has also earned a reputation as a shareholder‑friendly utility with a clear emphasis on dividend growth. The company’s payout is supported by the stability typical of regulated utilities — and by a capital allocation mindset that prioritizes resilience and continuity over flashy, cycle‑dependent results.
So the real question isn’t whether Fortis is a high‑quality business.
The question is:
Does Fortis fit your plan right now — at today’s valuation, yield, and expected dividend growth — or is it a name to keep on your watchlist until the setup improves?
In this Deep Dive, Fortis goes through the MaxDividends Five‑Pillar Formula — the same straightforward checklist we use to identify companies that can keep paying (and growing) dividends through recessions, rate cycles, and market volatility.
👉 Let’s break it down — step by step.
Table of Contents
How This Company Makes Money?
Do I clearly understand how Fortis Inc. (FTS) earns its money — and does the business make sense?
Fortis makes money in a classic utility way: it owns regulated energy delivery networks (electricity and natural gas), invests capital to maintain and expand those systems, and earns allowed returns set through regulatory frameworks. Cash flow is built on necessity + regulation + long‑lived infrastructure — not on consumer trends, product cycles, or advertising-driven demand.
Instead of “selling more products,” utilities primarily grow by growing rate base (the value of assets on which regulators allow a return). Fortis’ engine is therefore repeatable: invest prudently → put assets into service → earn an approved return → recover costs through customer rates → reinvest, service debt, and pay dividends. Here are the core earnings drivers:
1️⃣ Regulated Electric Utilities (Major Profit Engine)
A large portion of Fortis’ earnings comes from regulated electric transmission and distribution utilities. These businesses operate under defined service territories where the utility is responsible for reliable delivery and grid upkeep. Economically, the playbook is simple. Iinvest in grid modernization, resilience, and capacity, add that investment to rate base (after regulatory approval), earn an allowed return, with costs recovered through rates over time. This tends to produce steady, visible earnings compared with most industries.
2️⃣ Regulated Gas Distribution (Stable, Utility-Style Cash Flow)
Fortis also owns regulated natural gas distribution assets. Like electric utilities, gas utilities are built around essential service to homes and businesses, regulated rate structures and cost recovery, ongoing capital spending (maintenance, safety, replacement programs). For dividend investors, this segment matters because it adds another stream of predictable, infrastructure-backed cash flow.
3️⃣ Multi-Jurisdiction Utility Portfolio (Built-In Diversification)
One differentiator versus a single-state utility: Fortis operates across multiple regulatory jurisdictions in North America. That doesn’t eliminate regulatory risk, but it can reduce reliance on any one decision-maker and smooth outcomes over time. Think of it as a portfolio of regulated businesses where results are driven by many smaller rate cases and investment plans, rather than one “make-or-break” exposure.
4️⃣ Capital Program → Rate Base Growth (The Compounding Mechanism)
Utilities compound differently than consumer or tech companies. Fortis’ long-term compounding engine is its multi-year capital investment program: upgrading networks, expanding capacity where needed, improving reliability, and meeting safety and environmental standards. Over time prudent capex increases rate base, rate base supports higher earnings capacity, earnings capacity supports dividends (and, ideally, dividend growth).
The key strength is that Fortis sits in the “sweet spot” for income investors: essential service demand + regulated cost recovery + long-lived assets that must be maintained in every economy.
It’s not a black-box business. It’s a structured utility model designed for durability — the kind of setup that can support a long dividend track record when managed conservatively.
👉 And yes — this business model is clear, resilient, and makes perfect sense.
Is This a Good Stock to Buy Long Term?
Has the company shown the kind of consistency and resilience a long‑term dividend strategy needs?
Our approach is simple, but it works: we concentrate on durable, regulated cash‑flow machines like Fortis that have the structural ability to raise dividends over time. With companies built around essential services and long-lived infrastructure, the goal isn’t excitement — it’s repeatability. When a business can steadily grow its earnings base and convert that into consistent dividend increases, time becomes your best ally.
The MaxDividends Strategy Checklist – Simple Steps to Pick the Right Stocks
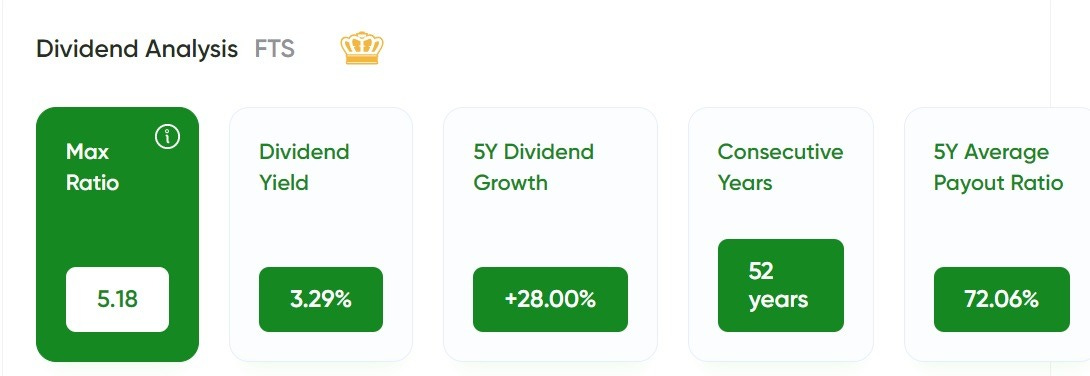
Step 1: Dividend History
Our filter: Companies with 15+ years of consistent dividend growth.
Fortis doesn’t just “qualify” on dividend consistency — it shows the exact long-term pattern dividend investors want: a clean, stair-step climb with no surprises. On the dividend history in CAD, the annual payout rises steadily from roughly CA$1.1 per share in the early 2010s to about CA$2.5 per share most recently. The shape of that chart matters because it signals a dividend built on repeatable utility economics rather than a one-time spike in cash flows.
This is what a true income compounder looks like in practice: no resets, no interruptions, just methodical annual increases that reflect durable cash generation and a capital return philosophy designed to share that durability with shareholders.
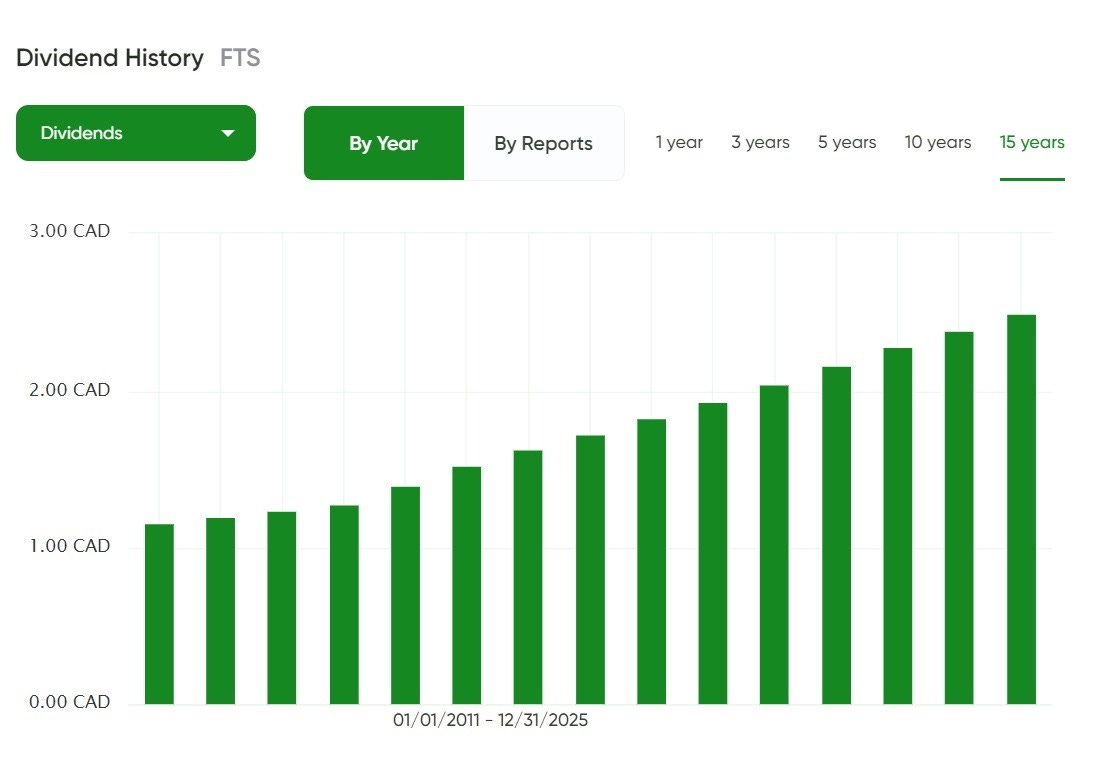
✅ Step 1 passed — Fortis (FTS) behaves like a Dividend Eagle, with a long, consistent record of dividend raises that aligns with the stability of a regulated, essential-service model and management’s commitment to dividend growth across different market environments.
Step 2: The Five-Pillar Secret Formula
1️⃣ Sales Growth – The Foundation of a Strong Business
Fortis’ top-line trajectory over the past decade looks like what dividend investors want from a regulated utility: steady progression, not a roller-coaster. On the 10-year view, revenue moves higher from roughly the mid‑single‑digit billions in CAD in the mid‑2010s to around the 12 billions most recently, with the chart showing a largely consistent climb rather than a boom‑bust narrative.
That’s exactly how a utility like Fortis is supposed to grow. The company isn’t dependent on consumers “choosing” its product or on hitting a perfect economic backdrop. Growth is primarily the outcome of regulated rate frameworks, ongoing investment in transmission and distribution infrastructure, and the gradual expansion of the rate base as new projects are placed into service and incorporated into approved returns. It’s intentionally boring, and that boredom is a feature for long-duration dividend compounding.
Just as important, there aren’t glaring holes in the trend. Even with normal year-to-year noise, the direction remains up, reflecting demand that customers can’t meaningfully defer and a business model built around cost recovery and system reliability.
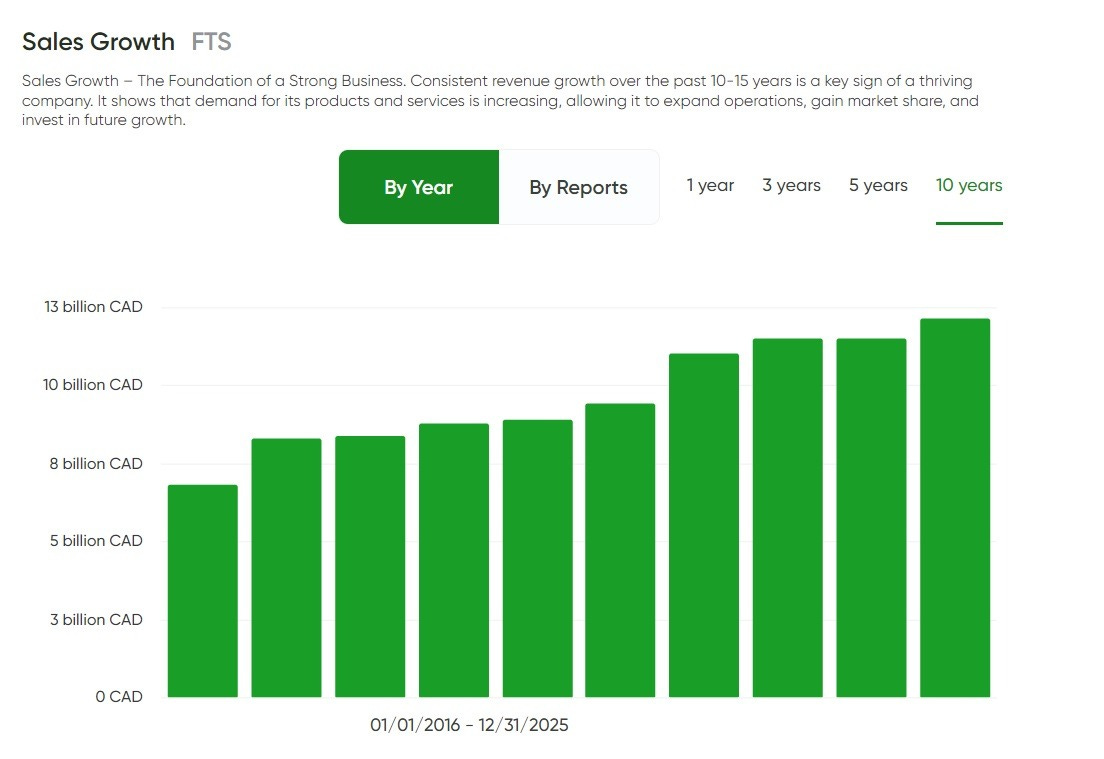
✅ Sales Growth passed — Fortis’ consistent top-line expansion supports the case that this is a stable, regulation-backed utility platform with a solid foundation for continued long-term dividend growth.
2️⃣ Profit Growth – The Fuel for Dividend Growth
Fortis’ profit growth picture is arguably even more supportive than the revenue trend. Over the last decade, profits rise in a mostly consistent, stepwise manner, and the most recent year shows a clear jump higher. From the chart, profit growth moves from roughly the mid‑CA$2 billions in the mid‑2010s to around CA$5–6 billion in the latest periods, capped by a standout spike near CA$9 billion most recently.
The “why” matters here, because this isn’t the typical story of a cyclical company enjoying a temporary demand wave. For a regulated utility like Fortis, profitability is shaped far more by rate decisions, approved returns, and disciplined capital investment than by consumer sentiment. When Fortis spends on grid hardening, system replacements, and network expansion, those assets can ultimately be rolled into rate base, which increases the pool of capital the company is allowed to earn on. That mechanism is what gives utility profits the ability to grind higher over time without requiring a perfect macro environment.
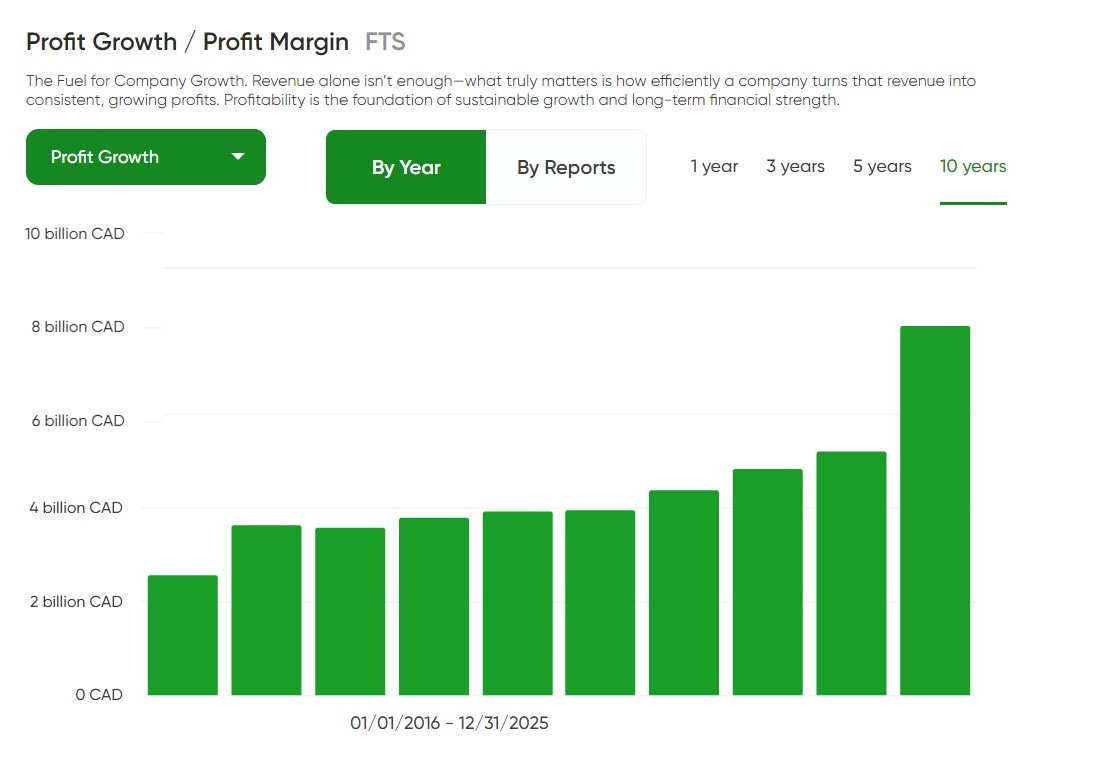
✅ Profit Growth passed — Fortis’ expanding profit base strengthens dividend durability and supports continued dividend increases while preserving the financial capacity to reinvest in the long-lived infrastructure that powers future compounding.
3️⃣ Net Income – True Measure of Strength
Fortis’ net income trend is the kind of “quiet compounding” dividend investors should appreciate, with one important nuance: it’s steady overall, but it also shows how reported utility earnings can occasionally be influenced by one-off items. Over the last 10 years, net income rises from roughly the mid‑hundreds of millions in CAD (around CA$0.6-0.7B early in the period) to a little less CA$2.0B in the most recent year, which is a meaningful expansion in after‑tax earnings power.
You can also see a notable spike earlier in the period, followed by a reset lower and then a re-acceleration. That pattern is exactly why we focus on direction and durability rather than demanding a perfectly smooth line every year. What matters for long-term dividend compounding is that the baseline moves higher over time, and in Fortis’ case the more recent years sit near the top end of the decade’s range.
For a regulated utility, this makes intuitive sense. Net income isn’t supposed to hinge on consumer “moods” or discretionary demand; it’s anchored by rate frameworks, approved returns, and ongoing investment that expands the rate base the company is allowed to earn on. When that model is working, you get a higher earnings floor over time — stronger coverage for the dividend, and more room to keep raising it without leaning on financial engineering.
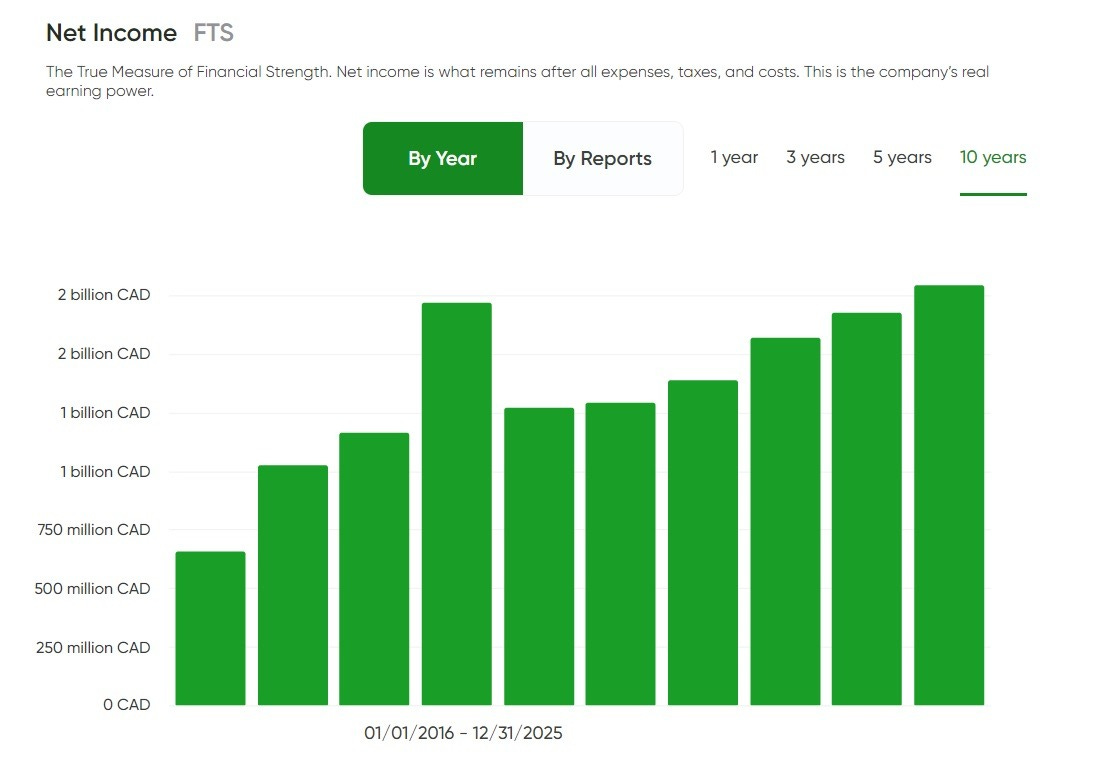
✅ Net Income passed — Fortis demonstrates a rising underlying earnings profile across the decade, reinforcing that its dividend growth is supported by real, expanding profitability rather than a temporary tailwind.
4️⃣ Dividend Payout Safety – Protecting Passive Income
For Fortis, the payout ratio picture looks exactly like what you’d expect from a well-managed regulated utility: elevated but controlled, with a clear intent to keep the dividend growing without starving the business of capital. Over the last decade, the chart shows the payout ratio sitting mostly around the low‑70% range, with one temporary dip into the mid‑40s before returning to its normal band.
That’s a practical setup for this industry. Utilities operate with stable demand and cost-recovery mechanisms, but they are also relentlessly capital-intensive, which means management has to preserve financial flexibility to fund grid investment, maintenance, and upgrades. Fortis’ payout pattern signals a deliberate balance — shareholders get a dependable and growing dividend, while the company retains enough earnings capacity to support its ongoing infrastructure program and avoid running with zero margin for error.
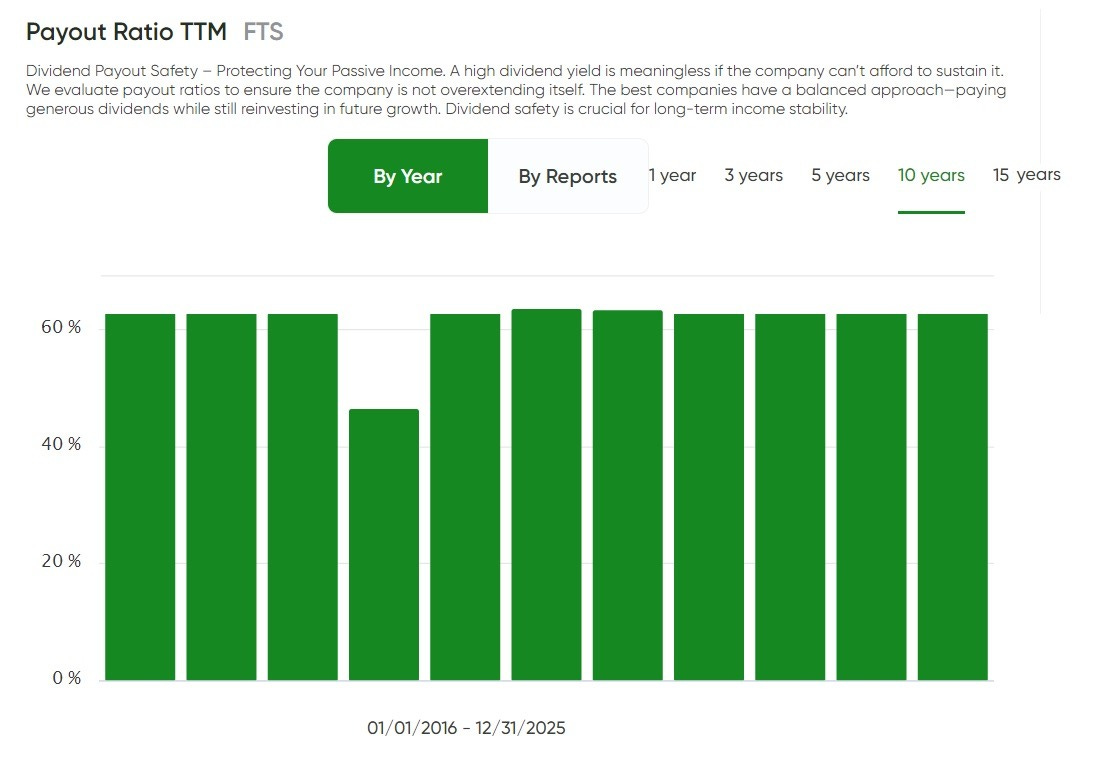
✅ Dividend Payout Safety passed — Fortis’ payout ratio has remained in a sustainable utility range, supporting a reliable dividend with room to continue compounding without cornering the balance sheet.
5️⃣ Debt Burden – Avoiding Financial Traps
Fortis does rely on debt, as essentially every large regulated utility does, but the key point is whether leverage stays controlled. On the 10‑year chart, Fortis’ debt ratio sits in a remarkably tight band, hovering around the mid‑0.60s for most of the period, with only modest fluctuations year to year. That’s exactly what “managed leverage” looks like in a capital-intensive, rate‑regulated business.
The context matters because for utilities, borrowing is not a sign of weakness by default — it’s often the standard way to finance long‑life grid and pipeline infrastructure that is recovered through customer rates over time. The red flag would be a balance sheet that keeps stretching just to maintain dividend optics. Fortis’ pattern looks more like planned, structural utility leverage supporting an ongoing capital program, not a company levering up to plug holes.
In practical terms, even if interest rates remain higher for longer, this doesn’t look like a leverage profile that automatically forces a painful choice between maintaining the network, funding growth capex, and supporting the dividend.
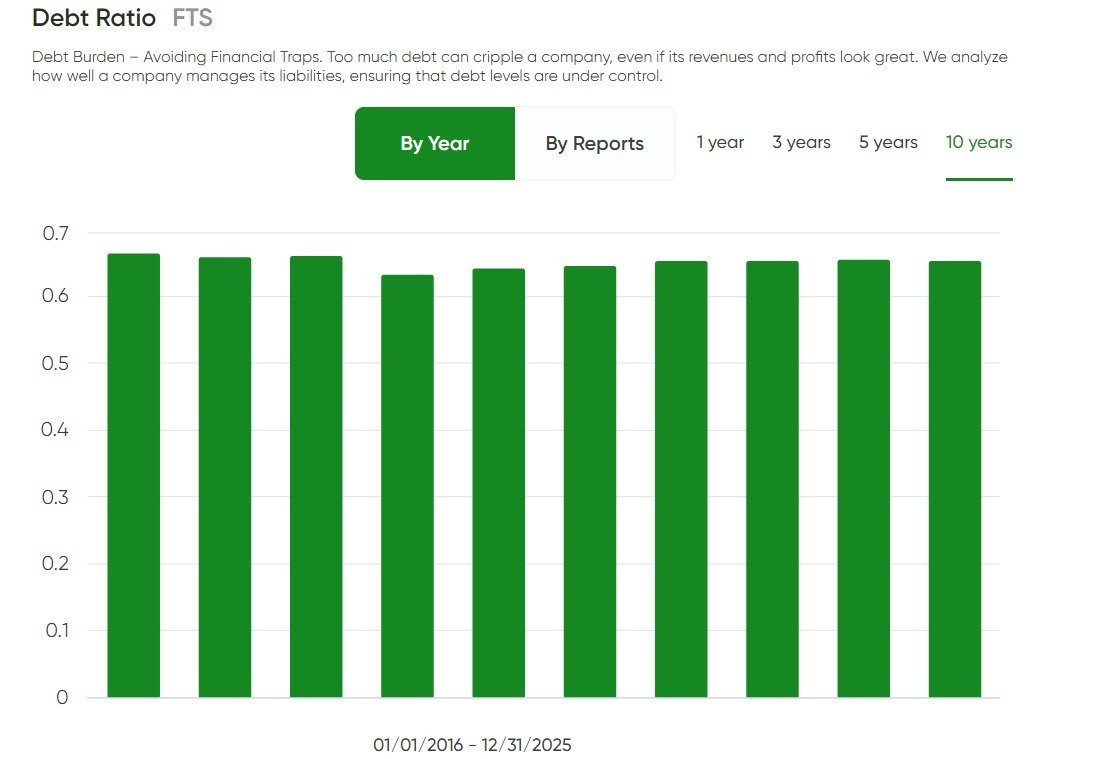
✅ Debt Burden passed — Fortis’ leverage has remained stable and contained over the decade, supporting the kind of financial resilience and dividend dependability long-term income investors want from a regulated utility.
Bottom Line: The Company Financial Condition?
Financial Score: 90 ⚠️
For Fortis (FTS), the Financial Score comes in at 89 (“Safe”). That’s just below our preferred 90+ threshold for the “very safe” tier, but only by a narrow margin. Practically, it still points to a strong overall financial profile for a regulated utility — one that should be capable of holding up across market cycles while supporting a long-term, dividend-compounding strategy.

MaxDividends Five-Pillar Secret Formula. Step 2 – ✅
By our Five‑Pillar Secret Formula, Fortis (FTS) screens as a high-quality, long-term dividend compounder that income investors can realistically build around. The business shows the kind of steady, regulated utility progression we want to see: a long runway of rising dividends, a decade of higher sales and higher underlying earnings power, and a payout ratio that stays in a sustainable utility zone rather than creeping into “no margin for error” territory. Leverage is clearly part of the model, but the debt ratio has remained stable across the period instead of steadily climbing into balance‑sheet risk.
Fortis doesn’t clear the framework with quite the same “room to spare” as the very top-scoring names, and that shows up in the Financial Score: 89, which is slightly below our preferred 90+ “very safe” threshold. Still, it lands firmly in the “Safe” range and aligns well with what long-duration dividend investors typically want from a regulated utility.
The Financial Score inside MaxDividends is built on these same five pillars, so you can quickly screen a company in seconds and then confirm it with the deeper, step-by-step checklist behind the score.
✅ Passed: Fortis (FTS) — Proven Dividend Eagle
Does It Fit My Plan?
Finding the Right Role for Every Dividend Stock – MaxRatio
Dividend stocks aren’t “one size fits all” and that’s exactly why they work so well when you’re building a portfolio around your own objectives. Some dividend names are best as long-duration compounders where most of the return comes from patient growth, others are ideal “do-it-all” holdings that blend income with steady appreciation, and a smaller subset is primarily about delivering meaningful cash flow right now.
That’s the job of MaxRatio. It frames a dividend stock’s profile using three practical inputs: the current dividend yield, the pace of dividend growth, and the company’s underlying financial strength.
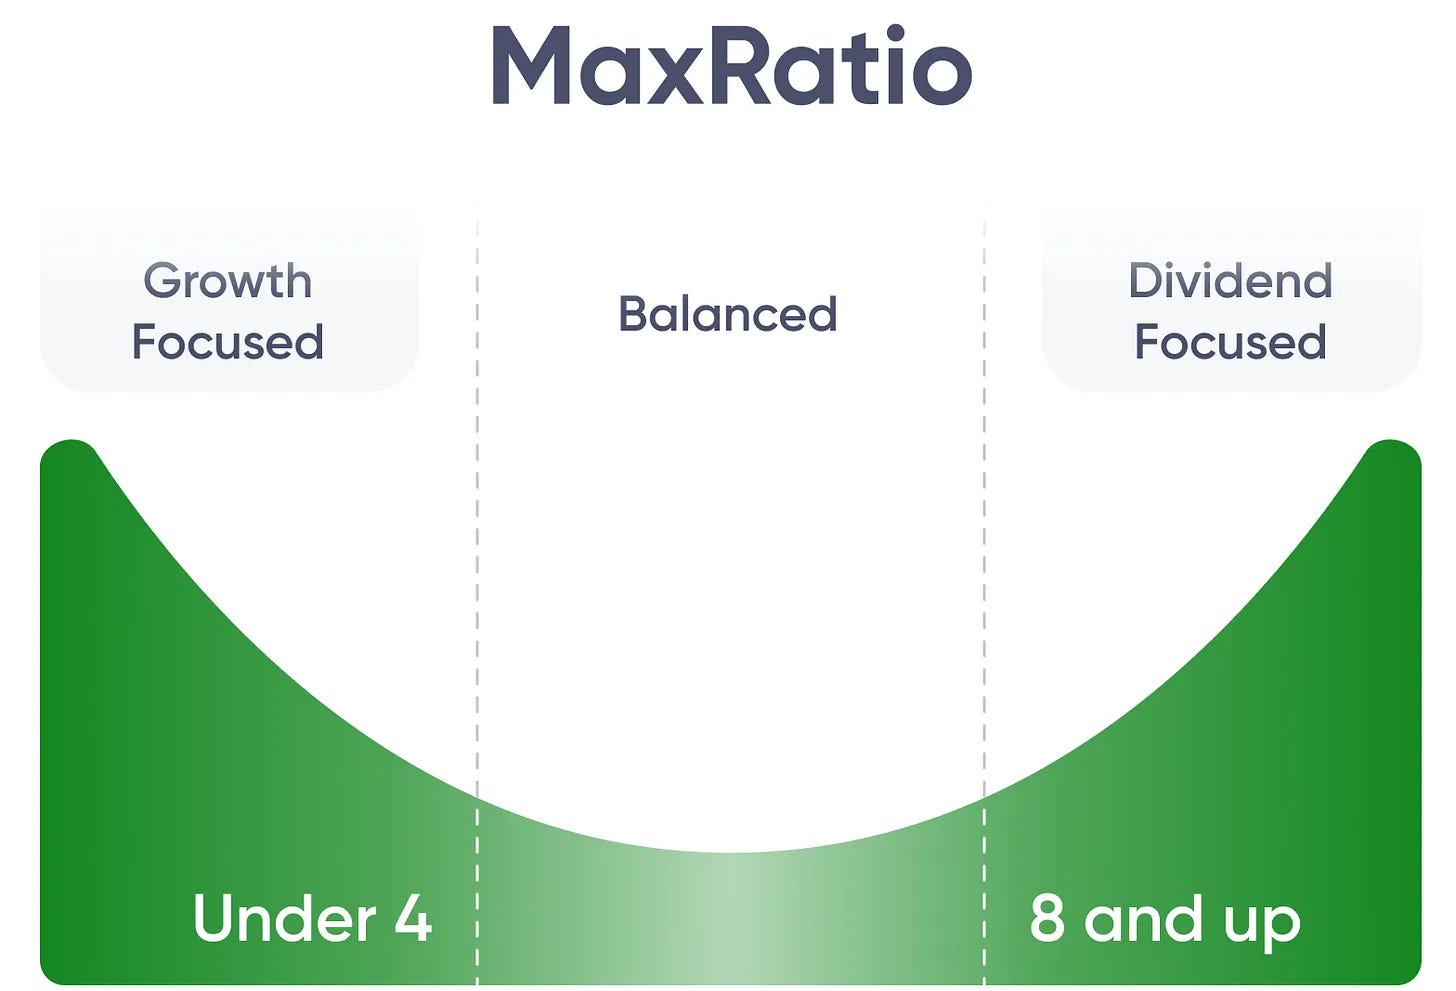
These three dimensions together tell you whether a stock should function as your growth accelerator, a steady value creator that compounds both gains and income, or your primary cash machine.
- 🚀 Growth Eagles (MaxRatio below 4) — These prioritize appreciation. Current yields may look modest, but they signal a healthy, durable business. You’re building serious long-term wealth while your dividend quietly compounds into tomorrow’s income stream.
- ⚖️ Balanced Eagles (MaxRatio 4–8) — The middle path. You earn meaningful dividends right now while watching those payments climb steadily, creating compounding on both your capital and your cash receipts.
- 💵 Income Eagles (MaxRatio 8+) — Pure income generators. These deliver fat yields today while adding steady, predictable growth — the perfect choice if your priority is hassle-free, dependable cash production.
MaxRatio exists for one reason: it lets you place each dividend holding into its proper role and assemble a portfolio that mirrors your personal objectives — whether you’re chasing explosive growth, seeking balanced gains plus regular payments, or maximizing today’s passive income stream.
Let’s Take Fortis (FTS)
Inside the MaxDividends app, you can open Company Analytics and instantly see the two numbers that matter most for quick dividend positioning: the Financial Score and MaxRatio — no spreadsheets, no manual digging.
For Fortis (FTS), the MaxRatio snapshot lands cleanly in the middle of the framework. Based on the chart, Fortis comes in with a MaxRatio of 5.18, which places it firmly in the Balanced Eagles (MaxRatio 4–8) category. In plain English, this is the profile of a utility that aims to give you a meaningful starting yield while still delivering enough dividend growth to keep your income stream moving higher over time.
That positioning makes intuitive sense for Fortis. Regulated utilities rarely look like “growth-first” dividend compounders because they’re designed to distribute a significant portion of earnings while continuously reinvesting in networks that require constant capital. Fortis’ strategy fits that reality: a dependable payout today, supported by regulation-backed cash flows, paired with the kind of steady, incremental dividend raises that suit long holding periods.
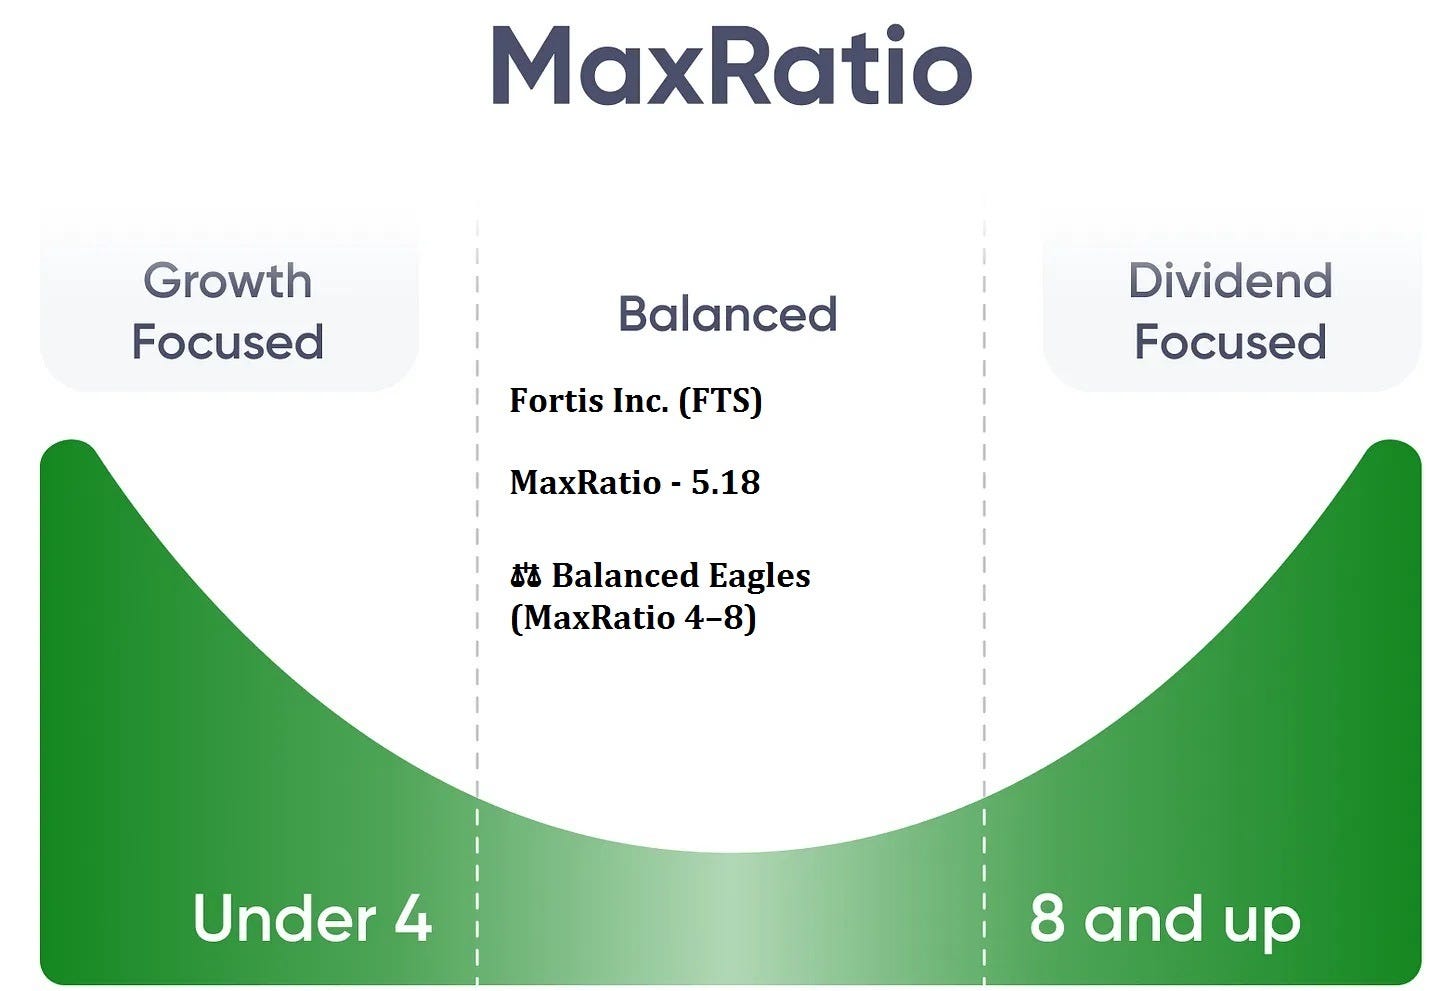
For investors building a core income portfolio, this is exactly the kind of low-drama role Fortis can play. It’s not meant to be a rocket ship, and it doesn’t need to be. The appeal is the combination of resilience, consistency, and an income stream that can keep ratcheting upward across market cycles.
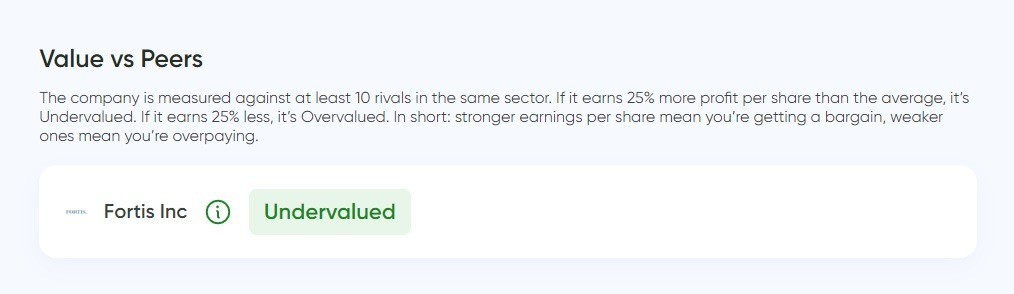
💵 Is the Stock Undervalued Today?
Cheaper than competitors?
🟢 Yes — Undervalued vs peers (per the MaxDividends App).
In other words, relative to comparable regulated utility names, the market is pricing Fortis at a more conservative level. You’re not being asked to pay a premium simply for the “sleep-well-at-night” factor or its dividend reputation; on a peer-relative basis, the stock appears to offer better value than the typical utility in its comparison set.
Cheaper than its own history?
⚠️ Expensive vs. its own 10-year average.
On a “value vs. itself” basis, Fortis (FTS) does not look cheap right now. The chart shows Fortis trading at about a 22.77 P/E today, versus a 10‑year average P/E of roughly 18.71. That means the stock is currently priced above its long-term norm.
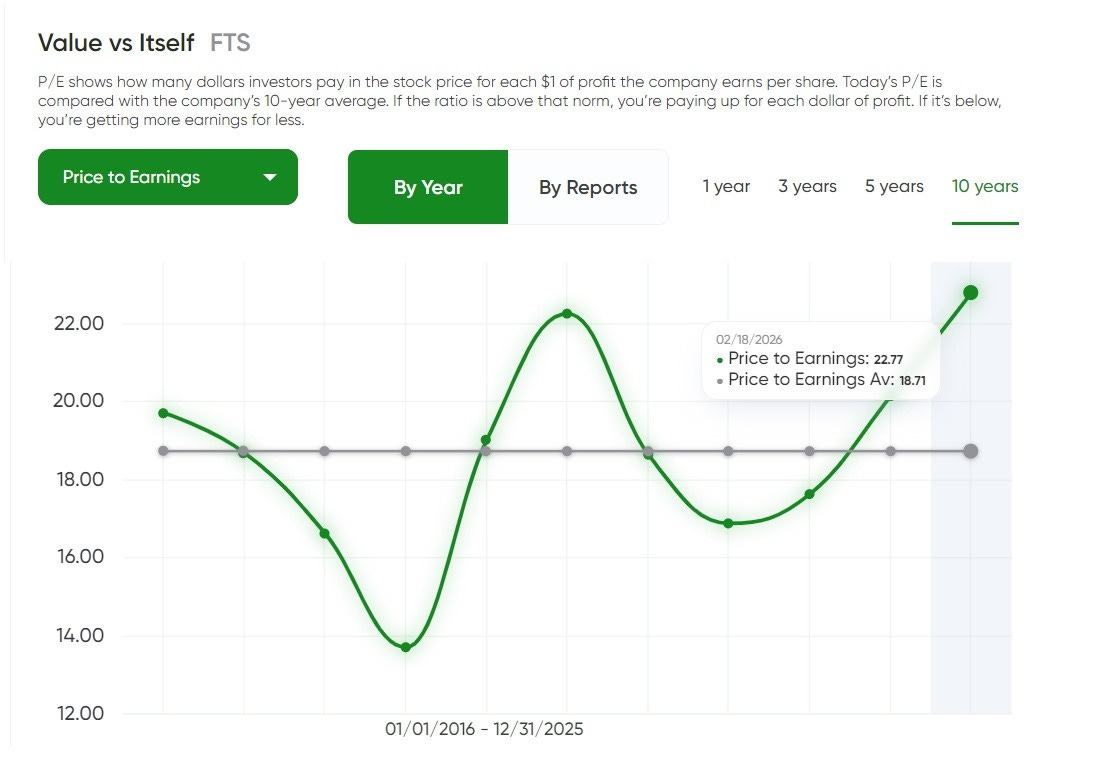
In plain English, investors are paying more for each dollar of Fortis’ earnings than they typically have over the past decade. That doesn’t automatically mean the stock can’t deliver solid results — regulated utilities can justify higher multiples when confidence in rate-base growth is strong or when the market is paying up for stability — but it does suggest there’s less help coming from valuation if the multiple simply drifts back toward its historical average.
Better Yield Than Usual?
⚠️ Yield slightly below its 10-year average.
Right now, Fortis (FTS) is yielding about 3.29%, while its long-term average yield on the chart sits near 3.66%. That gap tells you the starting income today is actually lower than what investors have typically received over the last 15 years, which usually happens when the share price has held up better than the dividend has grown in the near term, or when the market is assigning the stock a relatively firmer valuation.
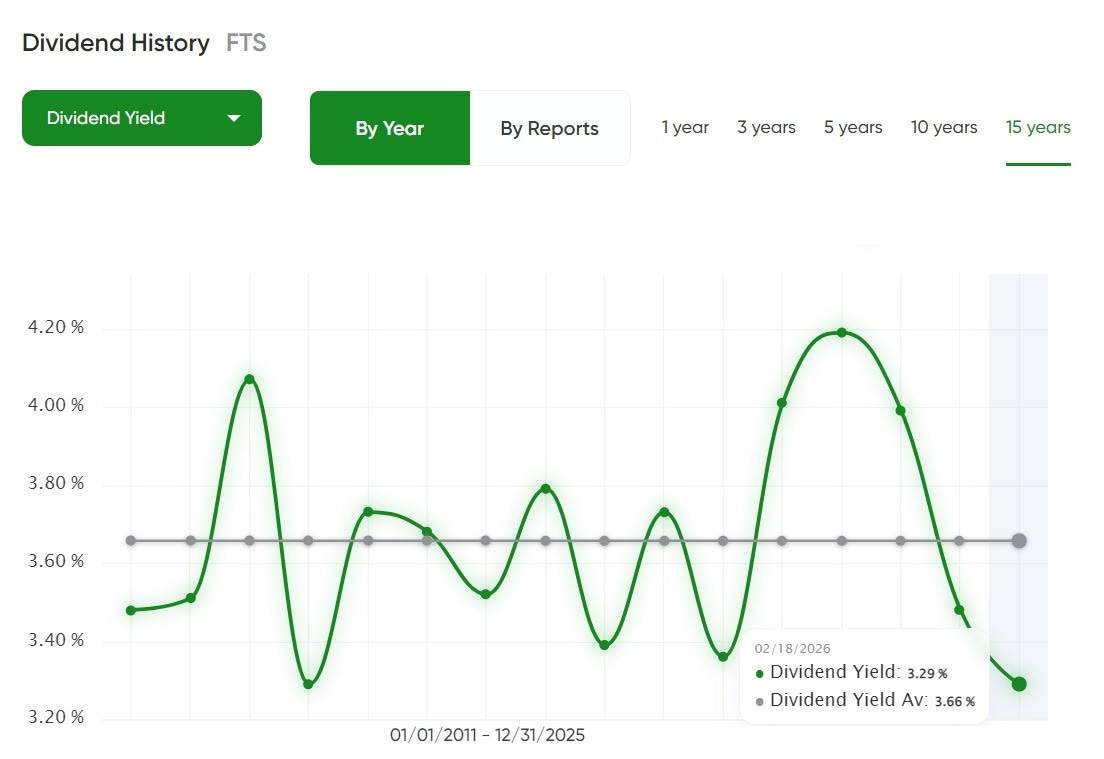
In plain English, Fortis is offering less income than usual versus its own history. That doesn’t make it a bad dividend stock — Fortis can still compound nicely through consistent dividend increases — but it does mean you’re not getting the “historically generous” entry yield that sometimes appears when utilities are out of favor.
For dividend investors, the decision becomes less about locking in an unusually high yield and more about whether you’re comfortable with the current yield level given your income goals and the expectation that future returns will be driven mainly by steady dividend growth and underlying utility earnings, rather than a big boost from yield mean reversion.
Analyst Consensus
⚠️Analysts don’t see upside potential for Fortis (FTS).
The chart shows an average 12‑month price target of about 74.97 CAD, which implies roughly -2.53% downside versus the current level. The forecast range runs from about 67 CAD on the low end to around 81 CAD on the high end, and the overall consensus is Neutral, based on 16 ratings split across a mix of Buy / Hold / Sell.
In plain English, Wall Street views Fortis as fairly priced in the short run. For dividend investors, that reinforces a familiar utility setup: the core return case is still the dividend plus steady, regulated execution over time, not a big one-year re-rating.
If the stock does well, it’s more likely to be because Fortis keeps compounding earnings and dividends while valuation stays reasonable, rather than because analysts expect a large price jump over the next 12 months.
Is This One for Me?
Here’s how Fortis stacks up under the MaxDividends lens:
How This Company Makes Money?
Do I clearly understand how Fortis (FTS) earns its money — and does the business make sense to me?
🟢 Yes: regulated energy-delivery cash flows built on rate base growth. Fortis makes money primarily by owning and operating regulated electric and natural gas utilities, where earnings are driven by approved returns on invested capital, ongoing infrastructure programs that expand the rate base, and periodic regulatory proceedings that set allowed returns and recovery mechanisms. The result is a business model designed for stability and visibility, with cash flows tied to essential service obligations rather than discretionary consumer demand.
Is This a Good Stock to Buy Long Term?
Has the company shown the kind of consistency and resilience I want to see?
🟢 Yes: Fortis is a proven dividend-growth utility with a long record of steady execution. Fortis has raised its dividend for decades, and the 15-year dividend chart shows the kind of uninterrupted, stair-step progression that signals durability rather than opportunism. That consistency is backed by the regulated utility model, where earnings are tied to rate-base investment and approved returns, which tends to hold up across economic cycles.
The main trade-off is that, like most capital-intensive utilities, Fortis isn’t built around ultra-low payout ratios. The MaxDividends data shows the payout ratio sitting largely in the low-70% range over the last decade, which is generally workable for a regulated utility but naturally provides less “excess cushion” than a high-growth company paying out a smaller share of earnings.
Is the Stock Undervalued Today? 💵
⚠️ Somewhat — it looks undervalued versus peers, but not cheap versus its own history. In the MaxDividends App, Fortis screens as Undervalued relative to its peer group, which suggests the market is pricing it more conservatively than comparable regulated utilities.
At the same time, Fortis looks more expensive than its own 10‑year norm on earnings. The chart shows a current P/E of about 22.77 versus a 10‑year average near 18.71, implying investors are paying more than usual for each dollar of Fortis’ profits. The yield picture points in the same direction: the dividend yield is roughly 3.29% today compared with a long-term average around 3.66%, meaning the current starting income is lower than Fortis has typically offered.
Taken together, Fortis doesn’t look like a deep value “slam dunk” on an absolute, history-based basis — but it does screen attractively on a relative basis versus peers, which can still be a reasonable setup for dividend investors who prioritize quality and steady compounding.
Does It Fit Your Plan?
Not every dividend stock is meant to do the same job, and that’s exactly why portfolio design matters. My approach centers on dividend names that either deliver a meaningful payout today and raise it steadily, or start from a moderate yield and compound that income stream through consistent increases over time.
Fortis (FTS) fits that blueprint as a classic “balanced utility compounder.” With a MaxRatio of 5.18, it sits squarely in the Balanced Eagles zone, signaling a mix of current income and ongoing dividend growth rather than an ultra-high-yield income play or a low-yield growth rocket. The long dividend track record is also the point: Fortis has shown a clean, stair-step pattern of increases over many years, which is exactly what stability-focused dividend investors want to see.
The underlying dividend thesis is straightforward. Fortis is built on regulated, rate-base-driven earnings tied to essential electric and gas infrastructure, which supports resilience across economic environments. And like most capital-intensive utilities, the payout profile is higher than what you’d see in low-payout growth compounders; the payout ratio has largely sat in the low-70% range over the last decade. That can be perfectly workable in a regulated model, but it does mean the “cushion” is naturally thinner than it would be for a company reinvesting more of its earnings.
Fortis is therefore a strong fit for investors who value reliability, defensive cash flows, and predictable dividend progression, and who are comfortable with steady, utility-style compounding rather than the faster dividend growth you might get from a lower-payout business.
Final Take
The same simple formula I just used for Becton Dickinson and Company (BDX) works for any stock. No hype, no noise — just clear steps that let you see whether a company truly fits your plan.
And the best part? This isn’t theory. It’s all already built into the MaxDividends app: the Financial Score, the MaxRatio, the Top Dividend Eagles list, and even my own personal shortlist. Everything in one place, ready whenever you are.
MaxDividends is a treasure chest for dividend investors of any size and focus. Whether you’re after growth, balance, or pure income, you’ll find the tools and the community to back you up.
This series of case studies is here to show you just how simple — and powerful — dividend investing can be. One stock at a time, you’ll see the clarity, the confidence, and the peace of mind that comes from building your own growing stream of passive income.