It is quite common to see the opposition of two popular exchange traded funds QQQ vs SPY. They track the largest US indices and offer investors to become co-owners of a diversified set of stocks of the best companies.
The article will compare these funds’ returns, net asset composition and other key metrics that should help a person choose the best ETF for their strategy.
Table of Contents
H2 SPY vs. QQQ – Performance Comparison
QQQ and SPY are exchange-traded funds with a history of more than 20 years. Their net assets include a set of stocks from over 100 issuers. Therefore, these ETFs will interest the passive investor who is looking for a way to maximize portfolio diversification.
Making the choice of whether to invest in QQQ or SPY requires understanding the similarities and differences between them. A brief overview is provided in the table below.
| Name | QQQ ETF | SPY ETF |
| Underlying index | NASDAQ-100 Index | S&P 500 Index |
| Number of stock types in the fund | 102 | 504 |
| Expense ratio | 0.18% | 0.09% |
| Value of assets under management (as of 06.02.2026) | $494B | $781B |
| Key sector (according to finance.yahoo.com) | Technology – 53.78%Communication Services – 15.81% | Technology – 35.86%Financial Services – 11.79% |
| Price per stock (as of close 06.02.2025) | $746.16 | $759.57 |
| Market capitalization (according to investing.com) | $666.13B | $495,83B |
At first glance, it seems that these are two very different funds, as they track different indices. But in fact, they share a significant proportion of net assets. Therefore, it makes no sense to add both QQQ and SPY to your portfolio.
The #1 Platform for Dividend Investors
Top Dividend Stocks & ETFs • Buy/Hold/Sell Ratings • Dividend Safety Scores • Income Strategies • Dividend Tracker • Premium Research
💬 Questions? Ask the Community →
H2: What is Differences between QQQ vs SPY
When deciding which of the 2 ETFs (QQQ or SPY) is more suitable to add to a portfolio, an investor needs to examine the 6 key points that the difference between SPY and QQQ boils down to.
H3 Strategy
Both funds follow a strategy of passive management and cost minimisation. Nevertheless, they copy different indices – the S&P 500 and the NASDAQ-100. Consequently, they are oriented towards different goals:
- SPY – provides the highest diversification level possible for an equity fund;
- QQQ – By virtue of being tracked by the NASDAQ Stock Exchange Index, this ETF focuses on the technology industry and is therefore suitable for investors who believe in its continued growth.
H3 Sector Diversification
If we compare SPY vs QQQ in terms of sector diversification, it is clear that QQQ, which is a NASDAQ-100 ETF, is strongly inferior to the SPY ETF. The tech sector accounts for over 50% of its net assets. More detailed information is presented in the table below.
| Sector/fund | QQQ | SPY |
| Technology | 53.78% | 35.86% |
| Financial Services | 0.23% | 11.79% |
| Communication Services | 15.81% | 11.35% |
| Consumer Cyclical | 12.26% | 10.25% |
| Consumer Defensive | 7.69% | 4.85% |
| Healthcare | 4.19% | 8.41% |
The table is compiled based on data from finance.yahoo.com as of June 03, 2026.
There are no financial companies in QQQ. The table demonstrates that the difference between SPY and QQQ is that the S&P 500 Index and SPY ETF provide much better options for diversification across economic sectors. Despite this, the tech sector accounts for over a third of assets in this fund and is actually 3 times more than the second largest sector.
H3 QQQ vs SPY Holdings
A key point of the QQQ vs SPY comparison concerns the degree of diversification by issuer. The SPY fund’s net assets include more than 500 securities versus the 100 included in the QQQ. The top 4 companies are identical in terms of holdings.
| Company | QQQ | SPY |
| NVIDIA Corp | 8.15% | 7.89% |
| Apple Inc | 7.28% | 7.05% |
| Microsoft Corp | 5.31% | 5.14% |
| Micron Technology, Inc. | 4.79% | 1.68% |
| Amazon.com Inc | 4.62% | 4.07% |
| Alphabet Inc. (GOOGL) | 3.94% | 3.41% |
The table is compiled based on data from finance.yahoo.com as of June 03, 2026.
H3 ETF Comparison by Returns
Different market situations favor one fund or another. For many years, the QQQ ETF has shown higher returns than the SPY ETF. Below is a SPY vs QQQ chart reflecting information over the past 10 years.
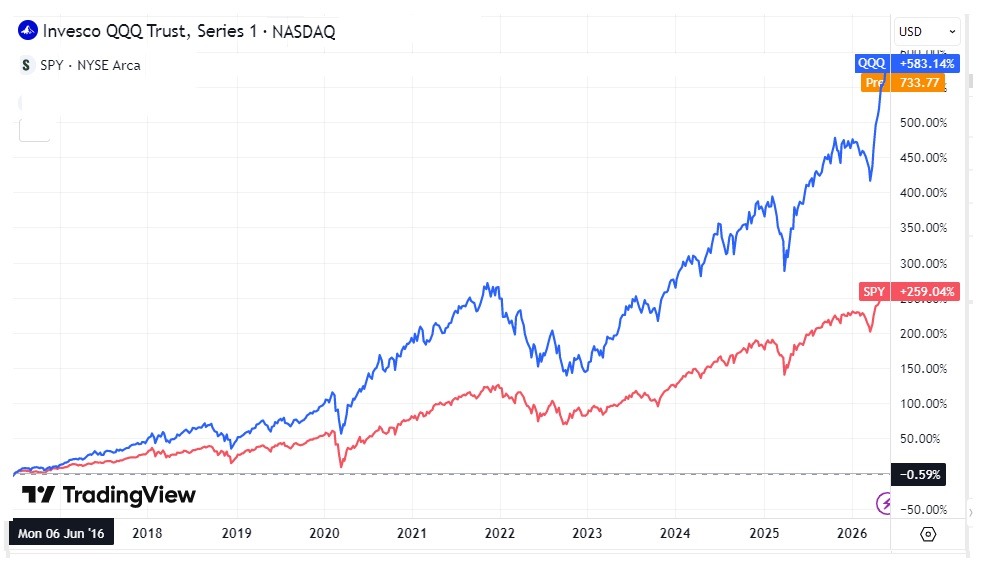
The chart clearly demonstrates that the SPY ETF lost less in value during the crisis periods in 2020 and 2022. But it yielded more for only a short time at the beginning of the selected period.
Risk-adjusted performance comparison is conducted using the Sharpe Ratio. As of June 03, 2026, QQQ leads with 2.64 compared to 2.38.
In the QQQ vs SPY dividend yield debate, SPY wins. It yields 0.98% vs. 0.38%.
H3 SPY vs QQQ Expense Ratio
When analyzing the funds’ expense ratio, the SPY outperforms the QQQ by a factor of 2. Its fee is less than 0.1%, while the QQQ retains as much as 0.2% of its net asset value per year.
But if you compare QQQ with some other equity ETFs, it’s clear that 0.2% is still quite low. In addition, the higher fees are offset by higher returns. But one must remember that past performance does not guarantee identical future performance.
H3 QQQ vs. SPY: Performance Metrics
Since the beginning of the year, the performance of the fund that tracks the S&P 500’s efficiency has been higher than that of QQQ. The latter leads in annualized returns over periods 1, 5 and 10 years.
The table presents a comparison SPY vs QQQ in terms of yield according to finance.yahoo.com as of June 03, 2026. For periods of 3, 5 and 10 years annual averages are shown.
| Time Period | SPY | QQQ |
| 1 month | 5.25% | 15.64% |
| 3 months | 10.50% | 7.55% |
| YTD | 11.23% | 8.86% |
| 1 year | 29.64% | 40.91% |
| 3 years | 23.46% | 28.19% |
| 5 years | 14.04% | 15.30% |
| 10 years | 15.54% | 21.11% |
The table, as well as the chart above, demonstrates that when comparing QQQ vs SPY from a historical performance perspective, the former fund is the more attractive. When looking at QQQ vs SPY over the long term, one cannot help but recognise that over the past 10 years, the QQQ ETF has proven to be a more profitable investment than SPY over long time periods.
But much in the comparison of QQQ vs SPY depends on the timing of buying and selling. For example, on March 27, 2026, QQQ fund quotes fell by -11.29%. The S&P 500 index drawdown for the same period of time was near -8.58% (compared to the beginning of the year).
H2 QQQ vs SPY – Similarities
There are similarities between the QQQ and SPY funds on two crucial points. Firstly, both ETFs are passively managed index funds.
The second important similarity is high liquidity. On June 03, 2026 the Average Vol. (3m) of these funds according to investing.com is:
- 67,284,353 for SPY;
- 50,997,788 for QQQ.
Both ratios are sufficient to be sure that the investor will quickly find a buyer whenever he wants to sell the assets.
Due to high liquidity, the minimum spread between the buy and sell prices in the stack is also achieved. For both funds, on average, this indicator is equal to 0%.
H2 What is SPY: Brief Intro
SPY is a passively managed exchange-traded fund. It was created by State Street Global Advisors and is traded on the NYSE Arca exchange. Key facts:
- Name – SPDR S&P 500 ETF Trust.
- Inception date – January 22, 1993.
- Dividend yield (TTM) – 0.98%.
- Sharpe ratio SPY – 2.38.
- Maximum SPY drawdown (5Y) – 24.37% (bottom – Sep 25, 2022 – Oct 01, 2022).
SPY tracks the S&P 500 index. It is the investors’ choice for those who want to get access to the broad U.S. market. The main advantage of the fund is its low commission. An important disadvantage is the linkage of the index it copies to the emitters’ market capitalization, which leads to excessive influence of large companies.
H3 SPY Performance
The goal of the SPY exchange-traded fund is to provide maximum exposure to the S&P 500 Index. The chart below illustrates the change for 10 years.
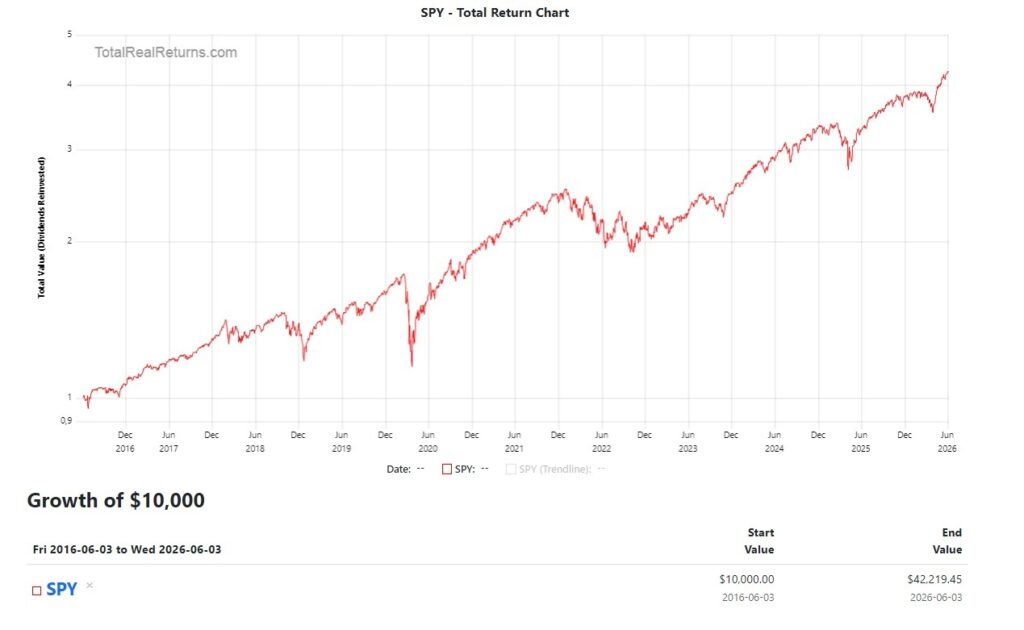
The graph takes into account both the growth in the value of the fund’s stocks and the dividends it pays.
H3 SPY Holdings
Here is a quick look at the 10 companies with the maximum weight in the number of ETF holdings.
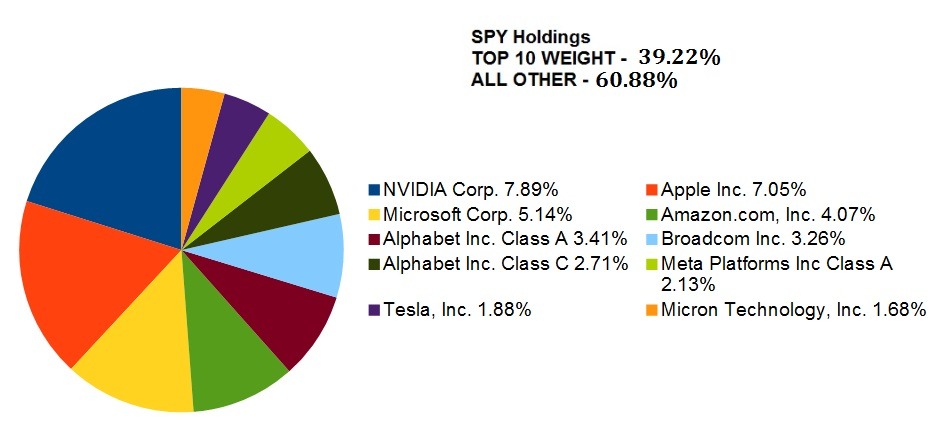
As of June 03, 2026.
H2 What is QQQ: Brief Intro
QQQ is the ticker symbol of another passively managed exchange-traded fund. It helps investors not only create a diversified portfolio, but also bet on fast-growing advanced sectors.
The ETF is managed by Invesco. Some key facts about the fund:
- Name – Invesco QQQ Trust ETF.
- Date of inception – 10 March 1999.
- Dividend yield – 0.38%.
- Sharpe ratio QQQ – 2.64.
- Maximum QQQ drawdown (5Y) – 32,97% (bottom – Oct 02, 2022 – Oct 08, 2022).
QQQ tracks the NASDAQ-100 market cap weighted index. Moreover, the influence of the 10 largest companies in this index is even more significant than in the S&P 500.
The NASDAQ-100 includes 100 non-financial companies from the NASDAQ stock exchange. This makes the QQQ fund more volatile and risky due to the predominance of tech companies.
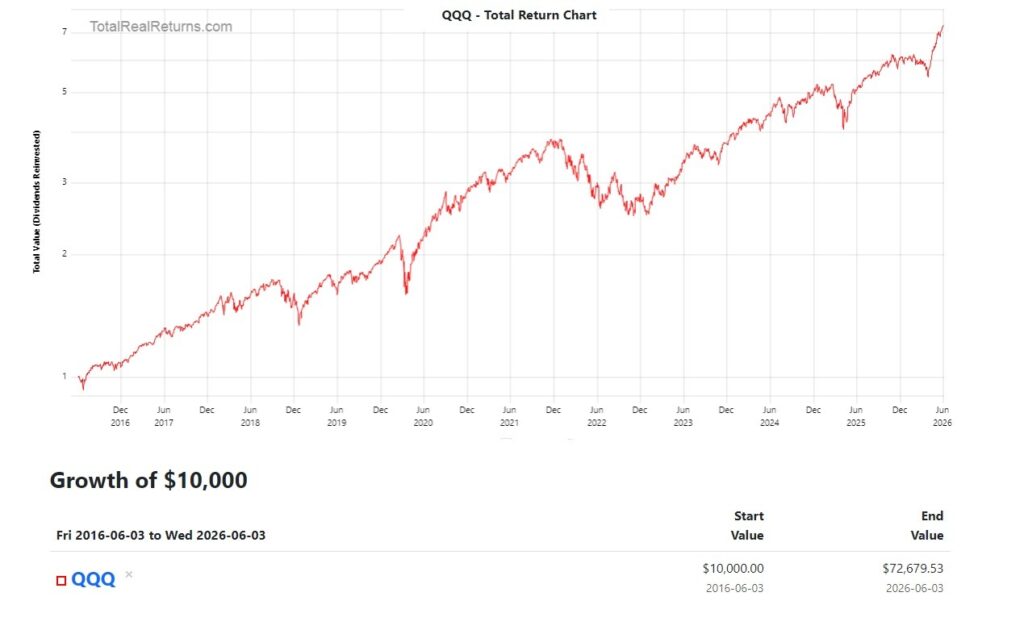
H3 QQQ Performance
The chart below illustrates the change for 10 years including dividends.
H3 QQQ Holdings
Top 10 holdings with the maximum weighting in the fund’s net assets are listed below.
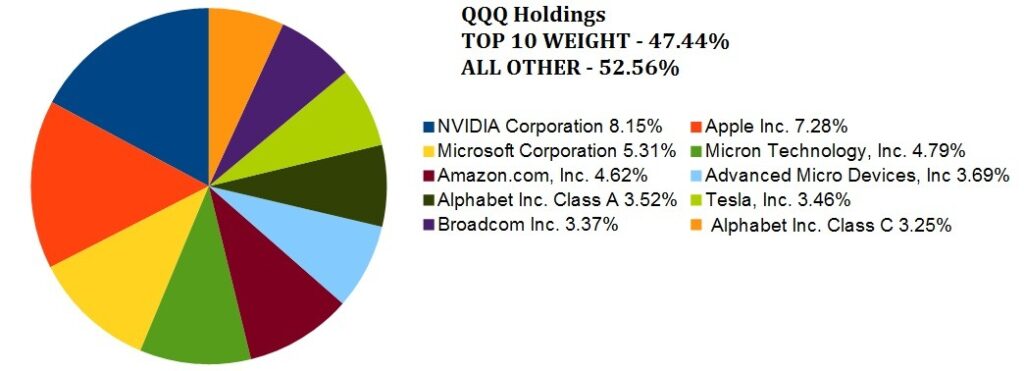
As of June 03, 2026.
H2 Both QQQ and SPY are Viable Long-Term Holds
Both funds are recommended for a long-term buy-and-hold strategy. When choosing QQQ vs SPY, one should remember that the net assets of these funds include mostly large companies. The number of mid cap stocks is minimal. There is another important consideration – the strategy a long-term investor uses. Many of them favor value stocks. But QQQ has almost no such companies.
This ETF is a large cap growth stock fund. That is, instead of undervalued assets, investors risk buying extremely expensive assets relative to the market average.
Quotes for tech funds and most companies are driven by expectations of future profits rather than current financial results. Some experts consider these assets overbought and constantly remind about the dot-com bubble.
H2 Conclusion – QQQ vs. SPY: Your Choice
Choosing QQQ vs. SPY long term should be for investors who believe that the dominance of the technology industry will continue in the coming decades.
SPY stock is suitable for people who follow the most conservative strategy possible, looking for the widest diversification at low costs. Besides, this fund will also attract investors willing to bet on all key sectors of the economy at once.
When comparing the two ETFs in terms of dividend strategy, SPY looks preferable. Although its current yield (0.98%) cannot be called high even for the US stock market.
The #1 Platform for Dividend Investors
Top Dividend Stocks & ETFs • Buy/Hold/Sell Ratings • Dividend Safety Scores • Income Strategies • Dividend Tracker • Premium Research
💬 Questions? Ask the Community →
H2 FAQ
H3 Is QQQ safer than SPY?
No, the higher the potential return, the higher the asset’s risks. The graph of QQQ quotes over the last 10 years demonstrates sharper price fluctuations than the SPY graph.
H3 Which ETF is better than SPY?
Other ETFs tracking the same index (S&P 500) include Vanguard S&P 500 ETF (VOO) and SPDR Portfolio S&P 500 ETF (SPLG). They have an expense ratio of just 0.03%. As a result, their 5-year returns have outperformed SPY by about 0.5%.
H3 Has QQQ outperformed the S&P 500?
According ETF comparison tools, the average annual return of the QQQ over the past 10 years has been 21.11% compared to about 15.54% for the S&P 500.
H3 Why is QQQ so popular?
For this reason, this exchange-traded fund provides an opportunity to make money in the technology industry, which has shown rapid growth in recent years. More than half of QQQ’s net assets are stocks of the largest companies in this sector. Among other advantages of this ETF are low commissions, a management company with a good reputation, and high liquidity.
H3 Does QQQ outperform SPY?
As of June 03, QQQ has outperformed SPY in 1-month and long-term performance.
Has QQQ ever been higher than SPY?
QQQ stocks have never been more expensive than SPY. However, it’s important to pay attention to volatility and annualized returns, not just the absolute price. In the future, QQQ may perform better. Based on historical results, SPY is expected to grow at a slower rate.
Is QQQ good for the long-term?
QQQ is better to buy for investments of a year or more. The NASDAQ-100 index dynamics are more volatile compared to the S&P 500. With a shorter investment horizon, there’s a high risk of a decrease in value.
Is Google in SPY or QQQ?
Google shares are included in both funds. These ETFs offer different investment options. They represent the consumer’s choice between a broad market or a technology sector. However, the key companies in their net assets are the same.
You Might Also Like
- Understanding Qualified Dividends: Tax Benefits & Criteria
- How Forward Dividend & Yield Works in Investing
- The Complete Dividend Aristocrats List for Reliable Returns
- Dividend vs APY: How to Calculate Your Actual Earnings
- MaxDividends Dividend Research Platform