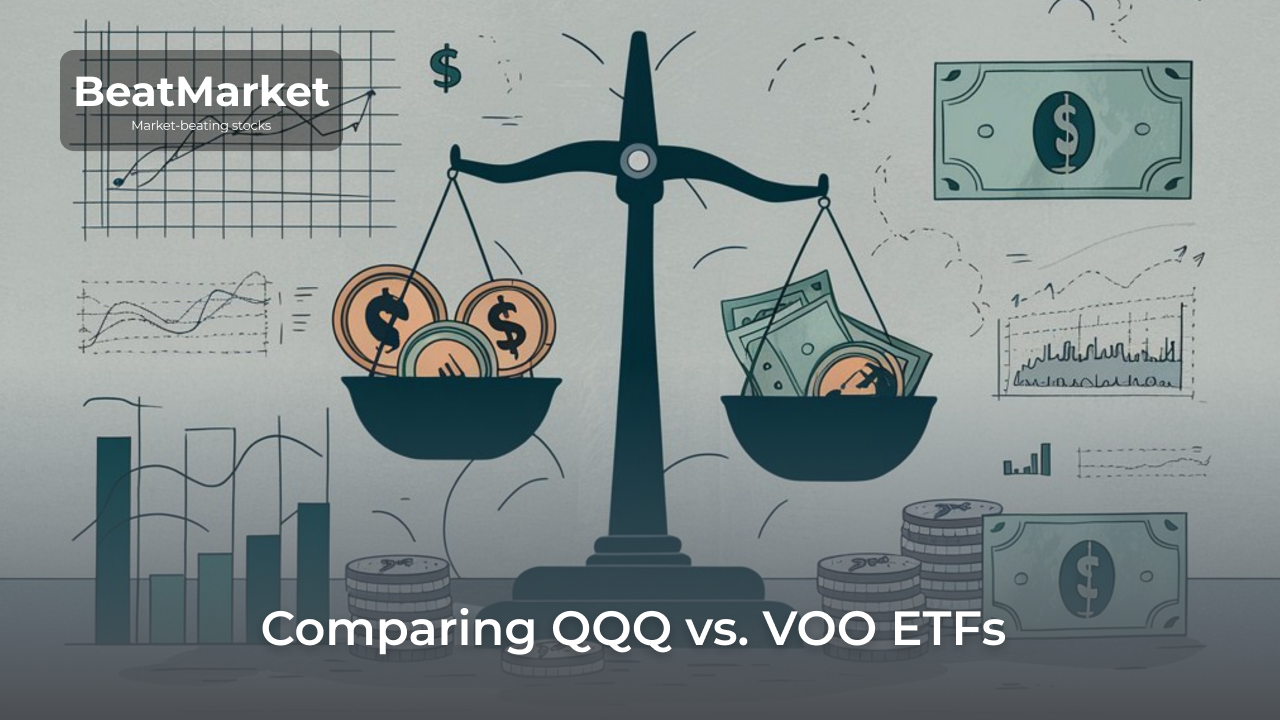
ETF comparison analysis (QQQ vs VOO) is necessary for investors to understand which of these funds best suits their financial goals and strategy. This article explains what each of these ETFs are, analyzing their similarities and differences.
While these funds do not track the same index, they both invest in stocks of major U.S. companies. Their net holdings overlap and their quotes move mostly in the same direction.
Table of Contents
QQQ and VOO ETF Comparison Analysis Takeaways
QQQ and VOO are two of the most popular ETFs. They have both been traded on US exchanges for a long time, are managed by trustworthy companies and can be considered a good long-term investment.
Both ETFs are traded on the exchange. The funds do not set minimum investment requirements.
To decide which of these ETFs to add to your portfolio, you need to do a detailed analysis of VOO vs QQQ.
The #1 Platform for Dividend Investors
Top Dividend Stocks & ETFs • Buy/Hold/Sell Ratings • Dividend Safety Scores • Income Strategies • Dividend Tracker • Premium Research
💬 Questions? Ask the Community →
QQQ vs. VOO Key Differences and Similarities
At first glance, QQQ and VOO are completely different assets. The difference between QQQ and VOO comes down to the following points:
- the underlying index (Nasdaq-100 and S&P 500);
- management company (Invesco and Vanguard);
- level of diversification (100 companies total vs. 500).
However, a closer look reveals that there are significant similarities between these funds. It is these that make it pointless to add both securities to the portfolio.
The key factor is the composition of net assets. Tech related stocks are heavily weighted in both ETFs, with the same companies topping the list of most important positions.
Parent Firm
VOO was created by a company called Vanguard. It owns the largest mutual funds in the US. And in the ETF market, it is the second largest manager in the world. The total value of assets transferred to it in 2026 exceeded $12 trillion (as of 30 November 2025).
QQQ is owned by Invesco. The size of this investment company is much smaller: about $2.45 trillion under management (as of May 31, 2026). But this is hardly a significant criterion when choosing between QQQ and VOO.
Benchmark Index Comparison
The Nasdaq-100, which is tracked by the QQQ fund, contains 5 times fewer companies than the S&P 500, which is copied by VOO. At the same time, it has demonstrated higher returns in previous years.
QQQ vs VOO Performance
If you compare ETFs over a period of 1 year and longer, QQQ outperforms VOO. However, there are no guarantees that it will replicate these results in the future. Over shorter time intervals, its returns are lower. For the last month (as of June 10, 2026), QQQ gives -1.39% compared to -0.63% for VOO (according to stockanalysis.com).
The picture below shows a VOO vs QQQ chart. It illustrates how the quotes of these funds have changed relative to each other over the last 10 years. The table next to it contains key return indicators.
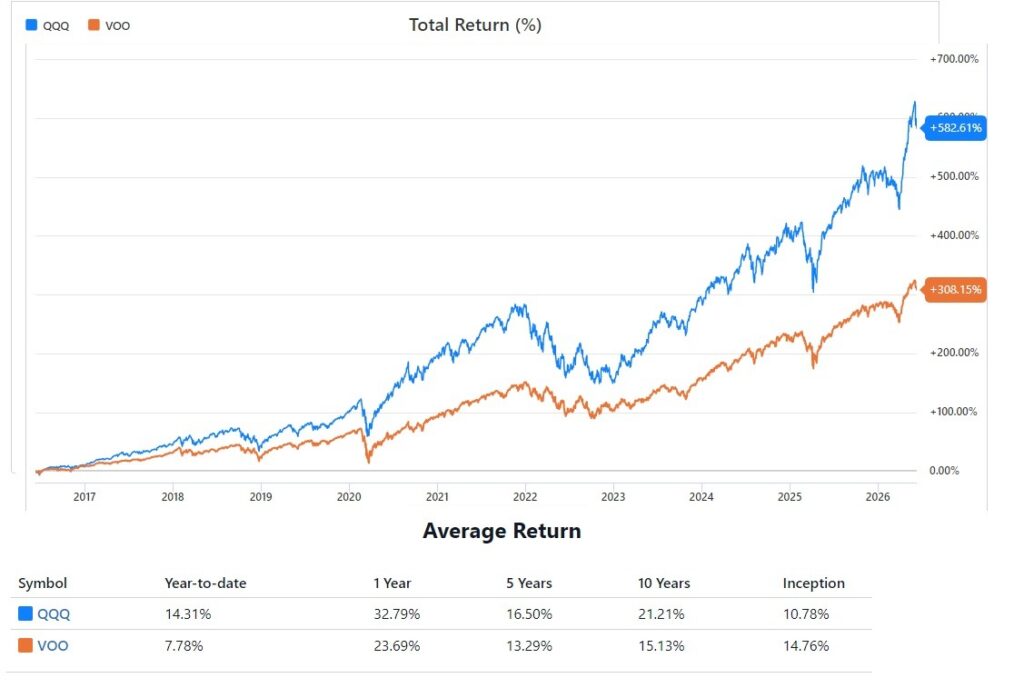
The image shows that the comparison of QQQ vs VOO performance will be in favor of the former. However, it is also more volatile, i.e. it has sharper ups and downs of quotations.
The reason for this is that about 46.47% of the fund’s assets consist of only 10 companies (8 of them belong to the technology sector). In VOO, the top 10 largest companies occupy only 38.37% of the total number of assets.
QQQ vs VOO Holdings
According to the index tracked in the VOO vs QQQ comparison, the first fund is more diversified. It outperforms the second ETF by 2 parameters:
- number of companies (500 vs. 100);
- even distribution of assets by sectors (in QQQ the technology sector accounts for 57.99% of net assets, in VOO – 35.67%).
However, both funds invest mainly in US companies with large capitalisation.
When choosing QQQ vs VOO, an investor should consider that most of the companies in the Nasdaq-100 are growth companies. The S&P 500 index includes value companies along with them.
Another important difference is that the S&P 500 also captures the financial sector, which is completely unrepresented in the Nasdaq Stock Market Index.
QQQ and VOO Holdings Overlap
The VOO and QQQ portfolio contains matching assets. Of the 100 companies included in the Nasdaq-100, 78 are also included in the S&P 500. If we compare QQQ and VOO by the top 10 companies, 8 of them will match.
The correlation between stock prices of QQQ and VOO is 0.93 (as of June 10, 2026, according to portfolioslab.com). This is considered to be a high indicator.
Expense Ratios
According to this indicator, in the comparison of VOO vs QQQ, the undisputed leader will be VOO with an expense ratio of 0.03% versus 0.18% for QQQ. But QQQ’s higher returns in recent years have offset this difference.
An Introduction to QQQ
QQQ is an exchange-traded fund managed by Invesco. QQQ tracks the Nasdaq-100 index. Basic Information:
- name – Invesco QQQ Trust;
- dividend yield over 12 months (as of June 10, 2026) – 0.4%;
- fund launch date – 10 March 1999;
- stock price – $707,83 (as of the close on June 09, 2026);
- market capitalisation – $726.87B.
Top Holdings
The Nasdaq-100 combines 100 companies whose stock are traded on the Nasdaq Exchange. The fund’s net assets include 104 securities. Information about the top 10 holdings is illustrated in the figure below.
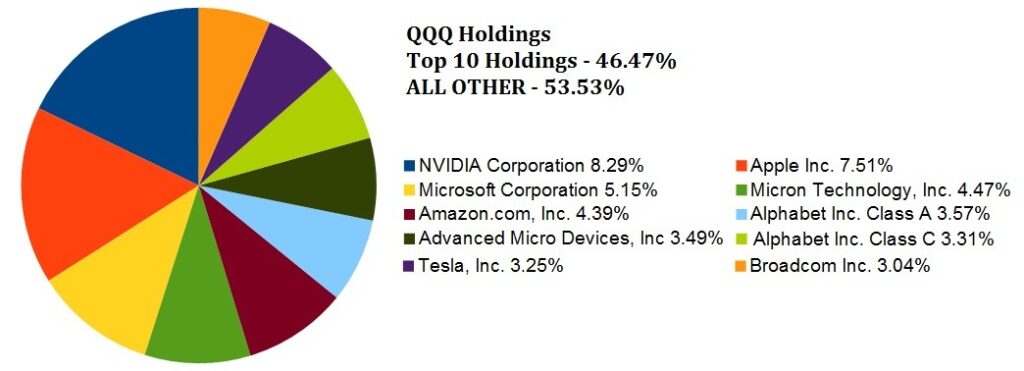
As of 06/05/2026 accordingly stockanalysis.com/etf/qqq/holdings/
Sectors
The technology sector leads the net asset composition of the QQQ.
As of 06/10/2026 accordingly finance.yahoo.com
QQQ Performance
Over the past few years, the Nasdaq-100 has performed better than the S&P 500. This was due to the rapid growth of the technology sector.
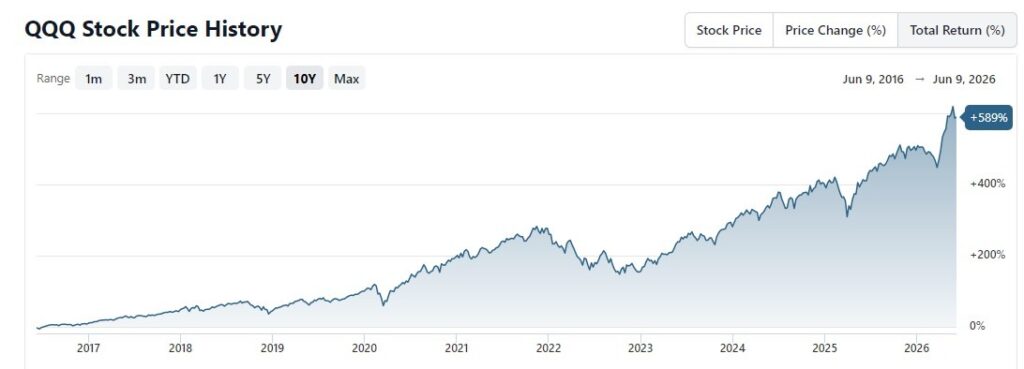
Between June 2016 and June 2026, the value of the Nasdaq-100 has increased more than 5 times. An investor who would have invested in a QQQ fund would now have about 589% of his or her original capital from stock price growth and dividends paid out over 10 years.
But during certain periods, it is possible to see drawdowns. The chart below illustrates the percentage change for 10 years as of 06/10/2026 (including dividends).
QQQ: Dividends
Payments are made quarterly. Key information is given in the table below.
| Parameter | Value |
| Annual Dividend (TTM) | $2.81 |
| Dividend Growth Rate (3Y) | 8.96% |
| Last dividend cash amount per share | $0.73 |
The table is based on data from seekingalpha.com as of June 10, 2026.
QQQ: Pros & Cons
The QQQ as an asset for long-term investment has many advantages:
- High liquidity. Spread between bids for purchase and sale tends to 0%.
- Good profitability on the results of past years.
- Moderate expense ratio.
The main drawback of this fund and the Nasdaq-100 is the dominance of the technology sector, which accounts for more than half of net assets. If the industry goes into trouble, QQQ will not bring much profit.
Therefore, the fund is suitable only for those investors who believe that the growth of the capitalization of technology companies will continue in future decades.
QQQ does not have the greatest degree of diversification. It includes only 100 companies. In the ETF market you can find funds that unite up to 2000 companies.
An Introduction to VOO
VOO is an index ETF managed by The Vanguard Group. VOO tracks the performance of S&P 500. Basic information:
- name – Vanguard S&P 500 ETF;
- dividend yield over 12 months (as of June 10, 2026) – 1.05%;
- fund launch date – 7 September 2010;
- price – $677.70 (as of the close on June 09, 2026);
- current market capitalisation – $479.53B.
Top Holdings
The S&P 500 index includes the 500 largest capitalization companies available on US exchanges. VOO’s net assets comprise 519 stocks (as some companies issue securities of several types). The top 10 positions of the fund are shown in the table below.
As of 04/30/2026 accordingly stockanalysis.com/etf/voo/holdings/
The dominant sector in the index and fund is Technology. It accounts for 35.67% of net assets of VOO.
VOO Performance
The technology sector in the S&P 500 index is about 1.5 times lower than that of Nasdaq-100. And over the past few decades, this sector of the economy has grown most rapidly. Therefore, VOO results are inferior to QQQ. From June 09,2016 to June 09, 2026, the Fund’s S&P 500 stocks prices rose by 2.48 times (from $190.43 to $677.7).
Below is the price dynamics of the total return in VOO for the last 10 years.
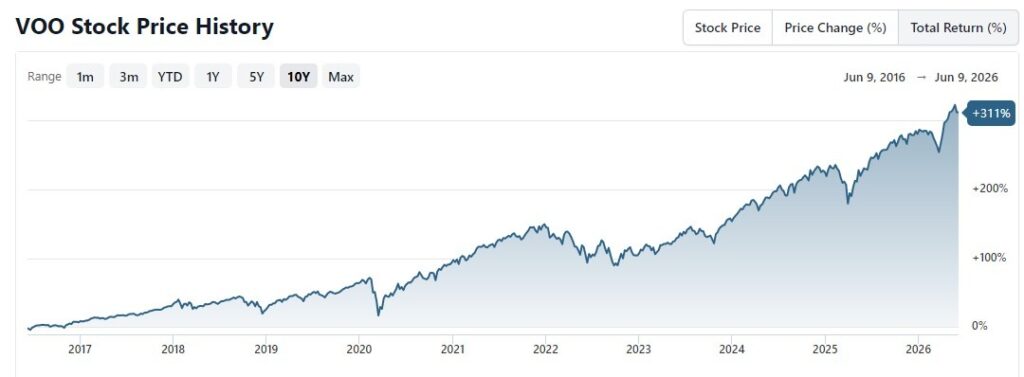
Source: https://stockanalysis.com/etf/voo/history/
As can be seen from the chart, VOO quotes are also subject to notable drawdowns during crises. Despite the high degree of diversification, this ETF still has a high level of risk.
H3: VOO Dividends
VOO offers shareholders to receive dividends quarterly.
| Parameter | Value |
| Annual Dividend | $7.13 |
| Dividend Growth Rate (3Y) | 5.56% |
| Last dividend cash amount per share | $1.87 |
The table is compiled based on data from seekingalpha.com as of June 10, 2026.
VOO: Pros & Cons
From a long-term investor’s perspective, the VOO has a number of advantages:
- High degree of diversification.
- Smaller share of tech stocks in net assets than in QQQ.
- High liquidity.
The downside of investing in VOO and any other fund tracking the S&P 500 can be considered to be the index’s low returns compared to some other assets. But future results will inevitably be different from the past.
This fund is suitable for people who do not want to bet mainly on one industry, but believe in the growth of the stock market as a whole.
The #1 Platform for Dividend Investors
Top Dividend Stocks & ETFs • Buy/Hold/Sell Ratings • Dividend Safety Scores • Income Strategies • Dividend Tracker • Premium Research
💬 Questions? Ask the Community →
Conclusion: A Side-by-Side Comparison of QQQ vs. VOO
To conclude the QQQ vs VOO comparison, here is a summary table of the key characteristics of both funds.
| Parameter/Fund | Invesco QQQ ETF | Vanguard VOO ETF |
| Issuer | Invesco | Vanguard |
| Base index | Nasdaq-100 | S&P 500 |
| 1 year total return | 34.22% | 24.55% |
| Average annual yield over the past 10 years | 21.21% | 15.13% |
| Expense ratio | 0.18% | 0.03% |
| Minimum investment threshold | No | |
| AUM (accordingly etfdb.com) | $472.816B | $980.205B |
The table is compiled based on data as of June 10, 2026.
These two ETFs have been around for many years and can be considered a good long-term investment. The net assets consist of securities of the best US companies. They bring consistent returns.
Investing in VOO is preferable for people who want to increase portfolio diversification across sectors and seek to minimize costs.
In the QQQ vs VOO comparison, it is better for those who believe in the continued dominance of the tech sector and are willing to take risks for the sake of above-average returns by reducing the degree of diversification.
FAQ
Is QQQ too risky?
According to the VOO and QQQ ETF comparison, QQQ is a riskier asset than VOO. The reason for this is that it relies much more on one sector of the economy. Therefore, if tech companies have problems, QQQ quotations will fall more than VOO.
Does QQQ overlap with VOO?
Yes. Approximately 76% of the net asset composition of this ETF can be found among the securities included in VOO. That’s why in the QQQ vs VOO comparison it is advisable to choose 1 of the funds rather than adding both to the portfolio.
Why is QQQ so popular?
The main reason for QQQ’s popularity is the past years’ results. QQQ has outperformed VOO by returns. Investing in this ETF against the backdrop of the success of technology companies yields higher returns than buying a broad market fund.
Should you invest in QQQ and VOO?
Both ETFs, QQQ and VOO, can be considered suitable to add to an investment portfolio. The choice of QQQ vs VOO long term should be made by the investor himself depending on whether he believes that the technology sector will outperform the broad market in the future as well.
You Might Also Like
- MLP Investments: Understanding Dividend Stocks and How to Invest in Them
- How to Calculate Dividend Yield: A Step-by-Step Approach for Investors
- High Yield Monthly Dividend Stocks: How Qualified and Ordinary Dividends Are Taxed Differently
- MaxDividends Research Platform