- The Forex market uses a trading strategy based on the EMA 200 to identify potential growth or decline in quotes.
- This strategy allows traders to identify entry points for long-term trades. Scalpers also use EMAs, but they analyze a smaller number of periods.
- The position of the exponential moving average of a currency pair on the chart allows one to evaluate trends in the market. Experienced traders often use EMAs to identify trends. This EMA strategy guide is useful for beginners in Forex trading.
- Trading with the 200 EMA is possible with any asset or currency pair. However, it is recommended to use this indicator in combination with other indicators or supplement it with a Price Action strategy.
Table of Contents
What is the 200 EMA?
The Exponential Moving Average (EMA) is defined as a technical analysis indicator used to identify trends. It is represented by a smooth line on the chart.
Calculate the points through which the EMA line passes using this formula:
Price x multiplier + EMA (previous day) x (1-multiplier)
The 200 day moving average is a type of exponential moving average that is calculated over a 1-day time period. It is commonly used to identify long-term trends.
There is another family of indicators called simple moving averages (SMA). SMAs calculate the arithmetic average for a specific number of periods using equal data.
The #1 Platform for Dividend Investors
Top Dividend Stocks & ETFs • Buy/Hold/Sell Ratings • Dividend Safety Scores • Income Strategies • Dividend Tracker • Premium Research
💬 Questions? Ask the Community →
Exponential moving averages give more weight to recent price data compared to SMAs. They take older prices into account with a decreasing coefficient, making them more responsive to fresh changes.
During periods of volatility, the exponentially weighted moving average is more effective than the SMA for trading.
How to Use 200 EMA in Forex Trading
Trading software, like the MT4 terminal, enables you to set a chart with indicators. Third-party trading platforms also offer a similar function for traders, such as TradingView.
There are multiple ways to use the 200 day moving average in Forex trading. Firstly, it can be used for identifying trends. To confirm the trend, analyze the 200 EMA line across three timeframes.
To begin, open a daily chart. Then, plot the EMA for the last 200 days.
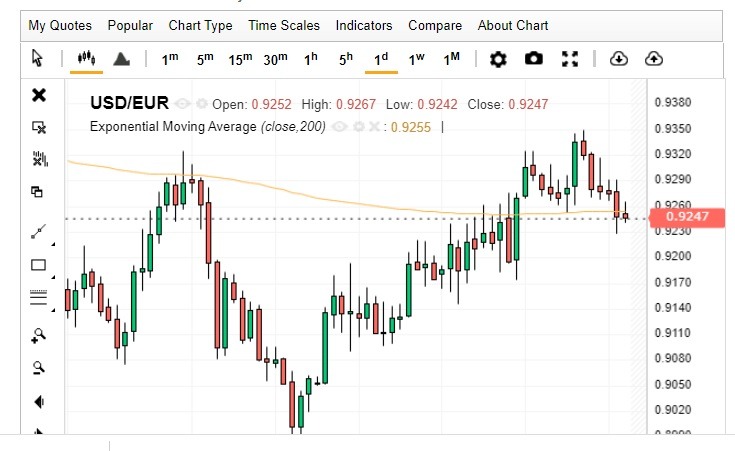
The indicator customization window is shown in the picture below. Traders can customize this tool independently by specifying the number of time periods for which the calculation will be performed and selecting the initial data. Typically, the closing price is used.
This will help suggest the future direction of the bias. If the current price is above the 200 EMA, there is an uptrend in the market, and we can expect the price to rise. If the price is below the 200 EMA, a downtrend is present, and the quotes are likely to continue falling.
The 200 EMA on the daily chart shows a long-term trend. To trade, check the lower timeframes and apply the trading indicator on the 4-hour and 1-hour chart. Consider opening a deal only when all 3 results match.
A trading strategy for forex and stock markets should not rely on a single indicator. Traders should use at least one additional tool to identify entry/ exit signals.
Traders often use the stochastic to confirm the entry point to a position when trading based on the 200 day moving average strategy.
If the stochastic is above 80 during a downtrend, it signals a short sell. This indicator value indicates that many traders have invested in this asset. If the price drops, their stop losses may be triggered, leading to further drops in quotes.
During a bullish trend, traders can open a long position if the stochastic indicator is below 20. This value suggests that many traders have sold the asset, making the probability of further sales and price decreases low.
To find an entry point, consider trading based on price action. Use the 200 exponential moving average to identify the trend, and candlestick patterns to signal when to enter.
The 200 EMA can be used not only for a moving average strategy but also as a support/resistance level in other methods. These lines often cause the price chart to bounce.
For example, below is a chart of AMD, current as of June 05, 2026. The selected timeframe is 1D. The chart features a 200 EMA. Red circles highlight points where the chart changed direction upon touching the line. In this case, the 200 EMA acted as support.
Traders can use the 200 EMA forex trading strategy to trade on bounces from moving averages. A trade is executed when the quote chart approaches this line. Traders anticipate that the price will not cross the 200 EMA.
The picture below demonstrates that these expectations are not always fulfilled. Initially, the 200 EMA line acted as resistance, but later it became a support.
Another strategy that makes use of the 200 EMA is to trade on the crossover of the 50 EMA and the 200 EMA. Buying is recommended when the 50 EMA crosses the 200 EMA from bottom to top, while selling is recommended when the 50 EMA crosses the 200 EMA from top to bottom.
To confirm the deal, check the corresponding figures of the analysis on the lower timeframe. For instance, look for a flag.
Trading strategies like the 200 EMA are great for active traders. But if you prefer long-term passive income over chasing price moves, dividend investing might be a better fit.
If you want to try this approach, check out the MaxDividends Research Platform — it makes finding and tracking dividend stocks much simpler.
Key Trading Rules and Parameters
Key trading rules for the 200-day moving average strategy:
- Use stop loss and take profit.
- Apply a trailing stop. This will adjust the trader’s stop loss as the price movement changes.
- Confirm the trend by considering three time periods.
Stop loss calculation can be done in several ways. One method is used when trading on price movements. For instance, if a bullish reversal pattern is detected on an uptrend, a trader can use this as a signal to place a stop loss order.
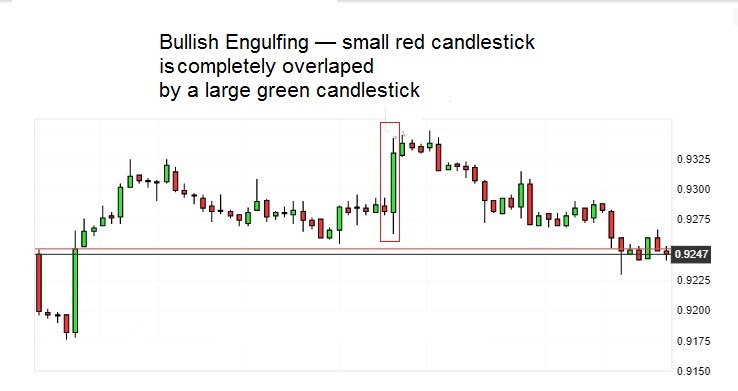
The screenshot below illustrates what a bullish takeover looks like on a chart.
The trader purchases the asset. In this scenario, a stop-loss is placed 3-5 pips above the highest point of the candle.
For those who trade on a pullback, consider placing a stop loss about 10-15 pips from the 200 EMA. If the position is bullish, place the stop-loss under the 200 EMA. If the position is bearish, place it above this line.
Take profit at the nearest support and resistance levels depending on the direction of the trade.
The #1 Platform for Dividend Investors
Top Dividend Stocks & ETFs • Buy/Hold/Sell Ratings • Dividend Safety Scores • Income Strategies • Dividend Tracker • Premium Research
💬 Questions? Ask the Community →
Pros and Cons of the 200 EMA Strategy
The table below summarizes the advantages and disadvantages of trading based on the 200-day moving average.
| Advantages of 200 EMA Forex Strategy | Disadvantages of 200 EMA Forex Strategy |
| Simplicity of applying the 200 EMA strategy | The EMA strategy cannot be applied when there is no main trend |
| Accuracy of signals in strong trends and in combination with other technical indicators | When the price moves sideways, there are many false signals |
| A more effective strategy is based on a moving average that gives more weight to recent price data. This strategy is sensitive to recent prices. | Alerts for trend changes lag behind |
| Trading strategies based on 200 EMA are applicable to all assets | Old data can influence trading decisions, even if it was obtained under different market conditions. |
| The 200 EMA can be used by traders of all skill levels. |
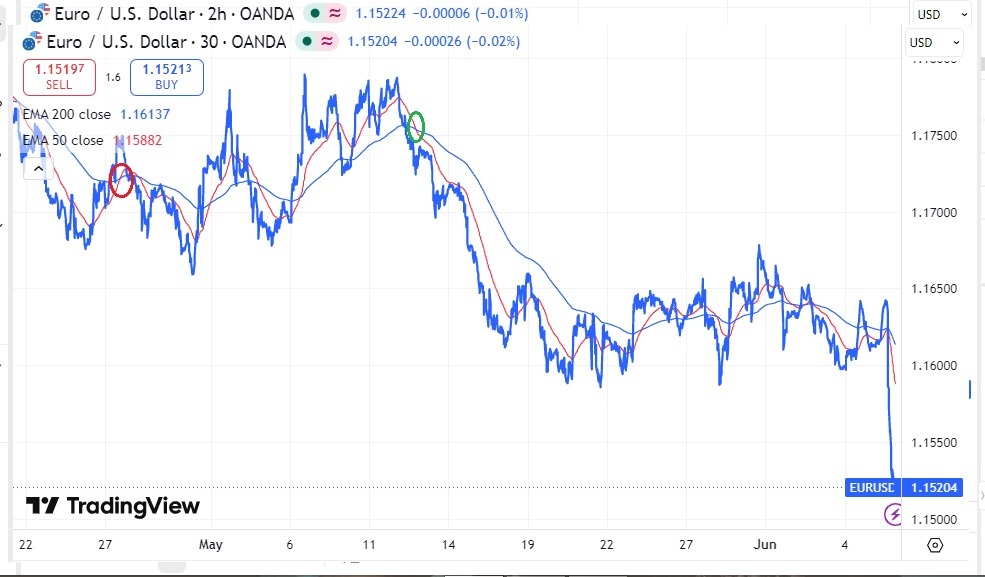
Here’s an example of the strategy in the screenshot below. The image shows a EUR/USD chart. It highlights that on April 27, 2026, the 50 EMA crossed above the 200 EMA. However, by that time, a significant part of the price rise had already occurred (red circle). A good example of the strategy can be seen at another point. On May 12, 2026, the 50 EMA crossed below the 200 EMA (green circle).
Tips for Using 200 EMA Effectively
The 200 EMA, like all moving averages, is a lagging indicator. Traders who use the 200 EMA receive delayed signals of trend changes.
Consider trading on a lower timeframe, such as a 5 minute chart, to speed up the appearance of the signal. This information is based on 200 periods of 5 minutes. However, this indicator is not commonly used for scalping or day trading.
The 200 EMA forex trading strategy is commonly used on older timeframes. We can get a reliable picture and open positions based on large swings by looking at a 200-day period.
However, there is a risk of unsuccessful transactions. Therefore, it is important to:
- comply with risk management;
- trade only after testing the strategy on a demo account;
- try different trading parameters to find the best combination.
A small percentage of the deposit is allocated for each trade. This protects you from being drained in case of a false signal. Using a demo account to practice a trading strategy can help to reduce losses. Additionally, it allows you to work out effective combinations with other strategies.
Conclusion
The 200 EMA is a widely used technical indicator that helps traders implement the ‘buy low and sell high’ strategy. Its popularity in Forex is due to its ease of visualizing prices and trends.
This strategy helps identify the main trend and look for buying or selling opportunities in strong bullish or bearish markets.
The 200 EMA is a good addition to trading based on other tools of thechanalysis. It allows you to identify potential entry and exit points.
The 200 EMA forex trading strategy is not flawless. Like any other strategy, it can give false signals. It should be traded according to the rules of risk management.
You Might Also Like
- The Right Way to Calculate Dividends: Formulas & Examples
- Hidden Gems: Undervalued S&P 500 Dividend Stocks
- Dividend Bank Accounts: Are They Right for You?
- Do You Pay Tax on Dividend Reinvestment? Key Facts
- MaxDividends Research Platform