Efficiency ratios are used to measure a company’s ability to effectively utilize assets to meet short-term liabilities and achieve acceptable financial performance in the current period. It is an important component of financial analysis which helps to monitor operating efficiency of the business.
Table of Contents
Defining Efficiency Ratios
Efficiency ratios are financial metrics analyzing a company’s ability to produce income. They show how rationally a business functions, whether it generates maximum profitability given the resources it uses.
The following are used as input indicators for analysis:
- expenses;
- capital;
- assets;
- revenues generated;
- revenue;
- profit.
This allows shareholders to determine whether the profitability of the business managed by them is sufficient. For shareholders, efficiency ratios measure a company’s health. The different efficiency ratios show how well a business has performed during the accounting period.
Financial analysts consider efficiency ratios of the company as a way to quickly assess the performance of a business. Studying financial statements takes time. Ratios can be compared much more quickly.
Usually, higher efficiency ratios reflect how well a company manages. But there are some issues. For example, for investment banks, the efficiency ratio formula takes the form: non-interest expenses/revenue. As a result, the lower its value, the better, although efficiency ratios usually should be higher than those of competitors.
Using Efficiency Ratios in Analysis
Efficiency ratios are an important metric for financial analysts. They have a wide range of uses for comparing peer companies and understanding which of them is the industry leader in terms of short-term efficiency.
The efficiency ratio calculations are based on data from the company’s financial statements. The following data can be taken from the balance sheet and income statement to calculate the required indicators:
- accounts payable;
- cost of goods sold;
- average total assets, etc.
The calculations of these aggregate numbers give a complete picture of the company’s current performance within a given period of time.
Types of Efficiency Ratios
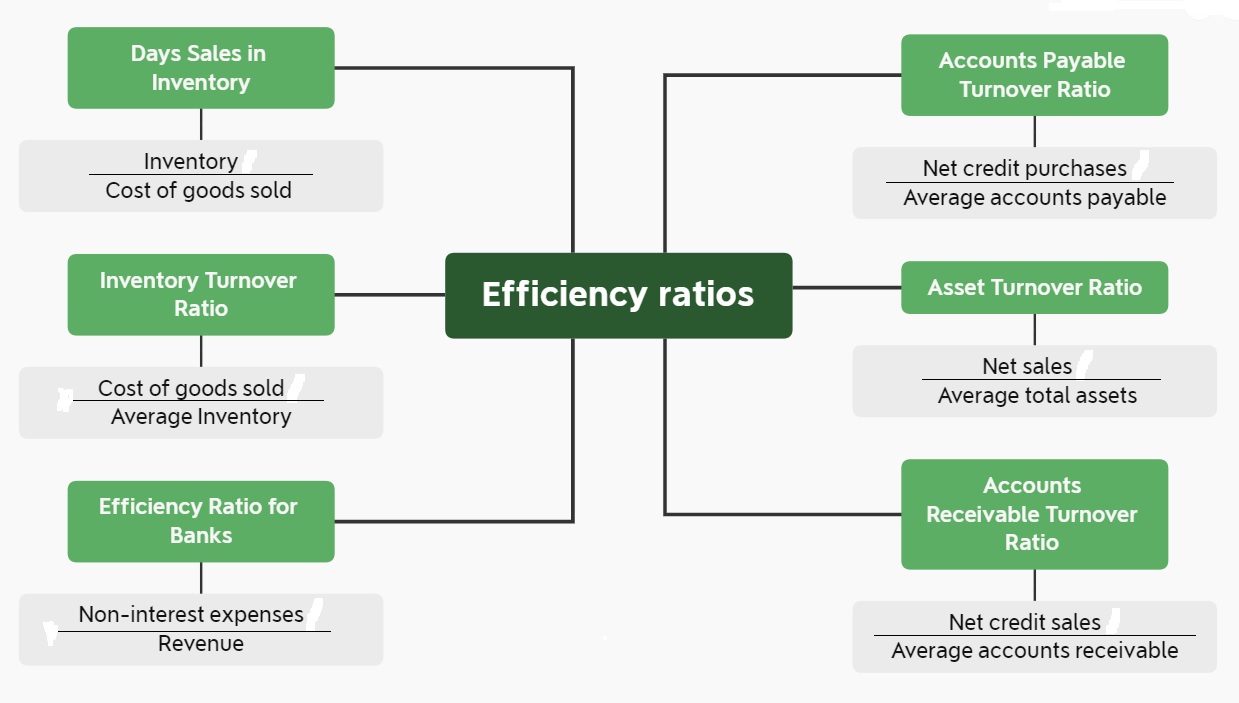
Examples of types of common efficiency ratios:
- inventory turnover ratio;
- accounts receivable turnover ratio;
- accounts receivable turnover ratio;
- asset turnover ratio.
Inventory Turnover Ratio
The inventory turnover ratio shows the number of times a company replaces goods in its warehouses ( sells them) in a specific period. A low inventory turnover rate is a negative factor.
Inventory turnover ratio measures how efficiently a company manages its inventory. An increase in sales is desirable in most cases. Therefore, it is favorable when this indicator is growing.
The exception is when the company expects increased prices or anticipates market shortages. When a company sells fewer goods, it may increase its profits in the future.
The formula by which the inventory turnover ratio calculates is: cost of goods sold during a certain period / average inventory for that period.
For example, the average inventory for the year is valued at $25 million. The cost of goods sold is $12.5 million. 12.5/25 = 0.5. Such a low turnover ratio indicates that the company is using its assets to generate profits inefficiently. But a comparison with competitors is necessary for final judgment.
Accounts Receivable Turnover Ratio
The accounts receivable turnover ratio indicates whether a company collects revenue in a timely manner. Accounts receivable are payments for a purchased product or delivered service. This ratio also measures a company’s ability to deal with debtors.
The ratio is calculated by dividing net credit sales by average receivables.
For example, a company has credit purchases of $1 million. The average accounts receivable at the end of the year is $200 thousand. The accounts receivables turnover ratio in this case is 5 (1000000/200000).
A higher accounts receivable turnover ratio is preferable. It effectively measures whether the company collects the average payments due frequently. That is, it shows that the time it takes to collect debts is lower than its competitors.
It is an indirect indicator of customer quality. Solvent customers close loans quickly. As a result, the accounts receivable ratio rises.
Accounts Payable Turnover Ratio
Accounts payable is money owed to companies/individuals. The accounts payable turnover ratio is a measure of short-term liquidity. It informs how often a company pays creditors over a period.
The value of this parameter is determined by the repayment arrangements made with the creditors. But it reflects the company’s ability to effectively manage debts and cash flows.
The calculation formula is as follows: net credit purchases / average accounts payable.
To find out the average accounts payable, add up the value of accounts payable at the beginning and end of the period. The resulting number is divided by 2.
For example, for the year they received goods and services in the amount of $300 thousand on credit. Accounts payable in this case amounted to:
- 75 thousand at the beginning of the period;
- 25 thousand at the end of the period.
300/((75+25)/2) = 6. I.e. the cash flow is sufficient for timely repayment of liabilities.
An inflated ratio does not mean higher efficiency either. It may indicate that the business uses its assets irrationally, for example, by not investing in development. As a result, over time, the ability to generate profits may diminish.
Each industry has its own optimal values for the financial ratio, that measures accounts payable turnover. The average value is a level between 6 and 10.
Asset Turnover Ratio
The asset turnover ratio measures how well a company uses its assets to make sales.
The higher the asset turnover ratio would, the more efficient a company is at using its production capacity and other resources to generate sales.
Indirectly, a high asset turnover ratio reflects the efficiency of inventory management. Since inventories are one of the components of assets. The higher the asset turnover ratio, the faster the conversion of inventories to cash.
The indicator refers to compare ratios. To tell whether it is high or low, you need to study several companies in the industry.
The formula for the asset turnover ratio will be: net sales / average total assets.
An example of how to calculate asset turnover efficiency:
- Net sales for the year – $500 thousand.
- Assets at the beginning of the year – $150k.
- Assets at the end of the year – $200 thousand.
The ratio we are looking for represents the number 2.85 (500/((150+200)/2).
This ratio means the company earns $2.85 for each dollar of total assets. For some industries, this will be a low asset turnover ratio, while for others it will be one of the best ones. For example, for telecoms, this ratio may even be less than 1.
Evaluating the ability to use its assets to generate profits through efficiency ratios is important for DuPont analyses of a company.
Days Sales in Inventory
Inventory sales duration indicates the average number of days it takes a company to fully turn over its inventory. Like the inventory turnover ratio, this indicator examines how efficient a business’s ability to manage inventory is.
The fewer days a company takes to sell its existing goods, the higher the inventory turnover ratio would be. When this period is too long, the company’s efficiency is low.
The formula is as follows: (average current inventory x 365) / sales volume.
For example, the average inventory is $600 thousand, and the sales volume for the year is $1.2 million. The required indicator will be 182.5 days.
Unlike most of the other ratios that are used, the values of this indicator are higher than those of competitors, indicating lower efficiency.
Comparing Efficiency and Profitability Ratios
Efficiency ratios and profitability ratios, along with activity ratios, are needed to assess a company’s ability to use resources efficiently. But they differ from each other as they emphasize different aspects.
The efficiency ratios focus is to determine the company’s ability to use resources well. The evaluation of profitability ratios is needed to determine a company’s ability to generate income in relation to its:
- shareholder’s equity;
- assets;
- operating costs.
High profitability ratios usually indicate good financial performance of a company. The calculation of efficiency ratios does not provide unambiguous information about current and short-term profit performance.
Using Ratios for Reporting and Analysis
Businesses often include efficiency ratios in annual reports. They are used both to evaluate short-term performance and to track changes over the financial/calendar year.
Efficiency ratios are not only important for comparison with competitors. When the efficiency ratio increases, it is an indirect indication that the business has become more profitable. It indicates that the company’s ability to generate revenue is increasing.
Accessing Data to Calculate Ratios
Many companies collect financial data to calculate ratios automatically and calculate them using special software.
Accounting involves working with large numbers. It is impossible to calculate them on a calculator. The calculation of efficiency ratios requires the joint work of accounting professionals and database administrators to correctly set up authorisation and access to records.
Instead of concluding: What is a good asset efficiency ratio?
These ratios measure a company’s ability to rationally utilize its assets and its operational efficiency. But they cannot serve as the only criterion for selecting assets. When a business has a lower efficiency ratio, i.e. a lower ability to use assets than a competitor, it is not always unprofitable. BeatMarket’s platform allows you to compare stocks on multiple parameters and select the best ones. Register for free and evaluate all the possibilities of the service!
You Might Also Like
- How to Find and Calculate Dividends: Step-by-Step Guide
- Best Undervalued Retail Dividend Stocks for Steady Income
- Deposit Dividends vs. Regular Dividends: Key Differences
- Reinvested Dividends and Taxes: What You Need to Know