
Table of Contents
Key Points
- The Sortino ratio is used to compare assets in terms of return per unit of risk. In this respect, it is similar to the Sharpe ratio.
- The Sortino ratio only considers the downside of the price. Profitability spikes have no effect on its value.
- It is not advisable to use the Sortino Ratio for bonds.
What Is the Sortino Ratio?
The Sortino Ratio is a tool for assessing the risk-return ratio of a portfolio or an individual asset. It is named in honor of Frank A. Sortino. In the 1980s, this economist suggested modernizing the Sharpe ratio.
He put forward the idea of separating downward deviation, which reduces returns, and overall volatility. The latter can be a positive factor.
When calculating the Sortino Ratio, an important concept is the risk-free rate or the minimum acceptable portfolio return.
How do you calculate Sortino Ratio? The Basics and Formula
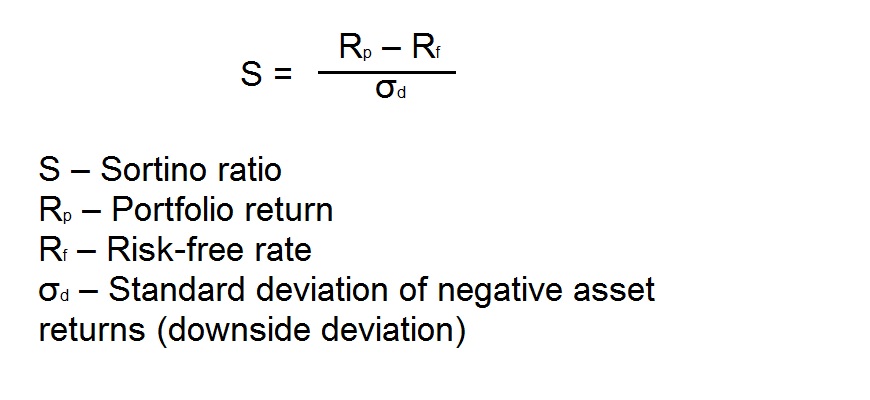
The calculation formula proposed by Frank A. Sortino is given below.
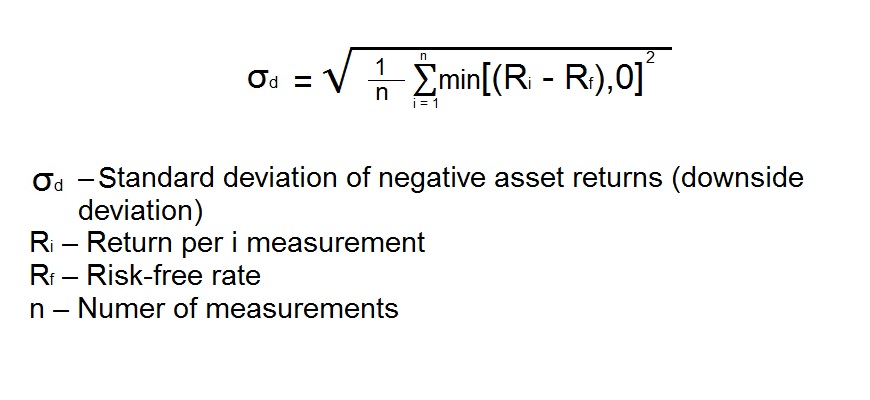
The Downside Deviation, which takes into account the Sortino Ratio, is determined as follows.
Portfolio return is calculated based on historical data. The risk-free rate is the minimum acceptable profit. Typically, the rate on a bank deposit or treasuries is taken as a given level.
How to Use the Sortino Ratio?
Investors, portfolio managers and analysts use the Sortino Ratio when comparing strategies in terms of risk-adjusted returns. This allows them to screen out funds that provide higher returns just by increasing volatility.
One needs to know in order to compare several options in terms of return for a given level of bad risk:
- portfolio return (for each of the funds/assets being compared);
- ratio uses only the downside deviation (calculated for each option separately);
- risk-free rate (must be identical in all cases).
A portfolio or asset with a higher Sortino Ratio will be more efficient in terms of the ratio of downside risk to also use expected return.
The disadvantage of the ratio is that it is of little use for a portfolio composed of heterogeneous assets. The Sortino ratio takes into account only stocks. In the case of bonds, it is unjustifiably overestimated.
The Ratio is used both for comparing individual stocks and for selecting the most efficient mutual fund of stocks.
Over longer periods, the Sortino level of risk starts to tend towards zero. There are works demonstrating the inefficiency of the methodology when the Ratio is calculated by taking into account more than 3 years of data.
Sortino Ratio vs. Sharpe Ratio: What is the Difference?
The Sortino Ratio and the Sharpe Ratio compare assets in terms of return and risk. The difference between the Sortino Ratio vs Sharpe ratio is that the Sharpe ratio uses standard deviation. As a result of being tied to overall market volatility, this ratio tends to reflect elevated returns as a negative factor.
The Sortino ratio focuses on the negative standard deviation and is spared this disadvantage. The Sharp ratio measures investment risk by taking into account downside volatility. Total risk, the variance used by William F. Sharpe, was replaced by Frank A. Sortino’s semi-dispersion.
In the calculation, indicators above the target level are assumed to be equal to zero and have no effect on the total. Thus, the Sortino ratio uses only negative deviation.
The Sharpe ratio decreases with any increase in the spread of quotes. In reality, upside movements are positive for the investor. The Sortino Ratio is calculated in such a way that the Sortino Ratio only uses an asset’s price fall as a negative factor.
Sortino Ratio in Action: Practical Examples
We will compare the performance of the portfolios of two mutual funds by means of the Sortino Ratio. We will take the values from the table as initial data.
| Parameter/Fund | Fund No. 1 | Fund No. 2 |
| Expected portfolio return (average annual fund return), % | 10 | 8 |
| Downside deviation, % | 7 | 3 |
| Risk-free rate, % | 4 | |
In this case, the following values can be achieved:
S1 = (10-4)/7 = 0,857
S2 = (8-4)/3 = 1,33
The ratio helps to understand that the first fund increases returns at the expense of an unacceptable increase in risk. The second fund has a much higher performance of an investment, i.e. return per unit of downside risk.
Here are step-by-step instructions on how to calculate the Sortino Ratio for a hedge fund or stock:
- Collect historical data for an asset. For example, upload information about the stock price at the close of the month for the last year.
- Calculate the historical return for each month. The closing price of the previous month (P0) is subtracted from the closing price of the current month (P1). The difference obtained is divided by the same amount. R1=((P1-P0)/P0).
- Determine the average return for the year. That is, add up all the numbers obtained in the previous step and divide by their number.
- Calculate the semi-dispersion. First we need to find the excess return for each month. The risk-free rate of return is subtracted from the actual return (numbers obtained at step 2). When the difference is positive, 0 is recorded. When the difference is negative – the final number is written down. Each value is squared. The obtained numbers are added up. The sum is divided by the total number of components (taking into account zeros). The square root is extracted from the result. This is the semi-dispersion, or Sortino risk.
- Determine the required indicator using the above formula.
You can make your own Sortino Ratio calculator using Excel.
| Step 1 | Step 2 | Step 3 | Step 4 | Step 5 | |
| January | 100 | ||||
| February | 125 | (B3-B2)/B2 | min (C3-Rf), 0 | ||
| March | 117 | (B4-B3)/B3 | min (C4-Rf), 0 | ||
| April | 130 | (B5-B4)/B4 | min (C5-Rf), 0 | ||
| May | 100 | (B6-B5)/B5 | min (C6-Rf), 0 | ||
| June | 110 | (B7-B6)/B6 | min (C7-Rf), 0 | ||
| July | 108 | (B8-B7)/B7 | min (C8-Rf), 0 | ||
| August | 112 | (B9-B8)/B8 | min (C9-Rf), 0 | ||
| September | 120 | (B10-B9)/B9 | min (C10-Rf), 0 | ||
| October | 125 | (B11-B10)/B10 | min (C11-Rf), 0 | ||
| November | 124 | (B12-B11)/B11 | min (C12-Rf), 0 | ||
| December | 113 | (B13-B12)/B12 | min (C13-Rf), 0 | ||
| (SUM(C3:C13))/11 | square((SUM((E2:E13)^2))/11) | (D14-Rf)/E14 |
A common mistake is to calculate the semi-dispersion without taking zero values into account. The ratio may result in an underestimated ratio.
What is a Good Sortino Ratio?
According to the trade-off theory, the return on investment should grow as volatility increases. The indicator under consideration allows measuring risk-adjusted profitability, i.e. it shows the rate of return per conditional metric of risk of quotations decrease.
The value of the Sortino Ratio is interpreted as follows:
- negative ratio – means negative return adjusted for the risk-free rate, such portfolio cannot meet the investor’s requirements;
- a ratio less than one – unjustifiably low, the portfolio/asset is inefficient;
- 1 to 2 – this value of the Sortino Ratio indicates that the strategy/asset is acceptable;
- from 2 to 3 – the ratio indicates sufficient investment efficiency;
- more than 3 – this Sortino Ratio indicates better investments.
The higher the ratio, the safer and more profitable the asset. But in reality, you will have to compromise between a high potential return on investment and a high Sortino ratio.
The Bottom Line and Investment Tips
The Sortino Ratio allows comparing different assets/portfolios in terms of performance due to risk-adjusted measurements. Unlike the Sharpe ratio, it only takes into account downside deviation. Due to this, it cannot “penalize” a sharp increase in returns. Therefore, it is considered more correct for evaluating the performance of mutual funds and financial advisors.
The theory of risk compensation is one of the investment basics. Without its understanding, a beginner will not be able to choose the right asset allocation. Therefore, those who are just beginning to study the stock market are advised to contact portfolio managers.
FAQs
H3: Which is better: Sharpe ratio or Sortino ratio?
Sortino and Sharpe ratios both have their upside and downside aspects. But the Sortino ratio is better because this ratio uses the bad risk, or decline volatility.
Since this ratio uses only the standard deviation of portfolio negative returns, it does not decline like Sharpe’s due to the fact that one period had a significantly higher return than the rest of the periods. This fact is discarded when calculating downside deviation.
What is the highest sortino ratio?
Theoretically, it can be as high as you like. In practice, it is difficult to find values higher than 3.
What does a large sortino ratio mean?
High Sortino and Sharpe ratios mean that investments are efficient in terms of return to risk ratio. In other words, such assets give a higher return per unit of negative volatility.
How do you find the sortino ratio using the sharpe ratio?
In essence, the Sortino ratio is a variation of the Sharpe ratio. But it is impossible to calculate one of them, only by knowing the value of the other one. They have the same numerator. But when the Sharpe ratio is calculated, it is divided by the standard deviation (dispersion), while the Sortino ratio is divided by the semi-dispersion.