Table of Contents
What is Mean Reversion?
The concept of mean reversion in trading revolves around the theory that asset prices tend to return to their historical average or mean over a period. This phenomenon forms the basis of various investment and trading strategies. Understanding mean reversion involves recognizing that after experiencing a deviation from its average price, an asset is likely to eventually revert to this mean. Traders use indicators and statistical tools to identify these deviations and anticipate potential price corrections. Implementing mean reversion strategies involves buying assets that are currently undervalued (below their mean) or selling those that are overvalued (above their mean), expecting prices to converge back towards their historical averages. This approach is widely applied across financial markets and requires a thorough analysis of historical data and market conditions to effectively time trades and investments.
Key Aspects of Mean Reversion
Mean reversion theory in trading emphasizes that asset prices and volatility tend to revert to their long-term averages over time. This principle has given rise to various trading techniques and models. Traders utilize concepts such as moving averages and oscillating indicators to identify instances where asset prices deviate from their historical averages. By recognizing these deviations, traders aim to anticipate potential reversals or corrections in prices, allowing them to strategically enter or exit positions in the market. The core idea revolves around the belief that extreme movements in prices will eventually normalize and return to more typical levels, forming the basis for employing specific indicators and trading strategies.
Understanding Mean Reversion
The mean reversion theory in finance states that asset prices tend to return to their long-term averages after notable deviations. This concept is essential for investment strategies. Investors using this financial theory seek to capitalize on these deviations by identifying undervalued assets (trading below their historical averages) and overvalued assets (trading above their historical averages). The strategy involves buying undervalued assets, expecting their prices to rise as they return to the mean, and selling overvalued assets, expecting their prices to fall as they return to the mean. This theory underlies various investment approaches that seek to capitalize on the natural tendency of asset prices to fluctuate around their long-term averages.
Suppose there’s a company, XYZ Inc., whose stock typically trades around an average price of $50 over the past few years. However, due to recent market fluctuations or company-specific news, the stock price has dropped to $35, significantly lower than its historical average.
Mean reversion theory suggests that, over time, the stock price of XYZ Inc. is likely to revert toward its long-term average of $50. Investors employing mean reversion strategies would view this deviation as an opportunity.
Here’s how this theory can guide investment strategies:
- Identifying Undervaluation: Recognizing that the current price of $35 is below the historical average of $50, investors using mean reversion might see this as an opportunity to buy the stock, expecting its price to move back towards $50 over time.
- Buy Low, Sell High Strategy: Investors following mean reversion principles would purchase shares of XYZ Inc. at $35, anticipating that as the price reverts to its average, they can potentially profit when the stock reaches or nears its historical average of $50.
- Setting Exit Strategies: These investors might establish exit strategies, such as setting a target price or utilizing indicators, to sell the stock once it approaches or surpasses its historical average. This allows them to lock in profits from the expected price movement.
- Risk Management: However, it’s important to note that mean reversion isn’t guaranteed. Investors would also set stop-loss orders or risk management mechanisms to limit potential losses if the stock doesn’t revert as anticipated.
Using Mean Reversion in Trading
Traders employ mean reversion in various ways, leveraging statistical analysis, specific trading techniques, and algorithmic strategies to capitalize on market inefficiencies. These methods include:
🔹Statistical Analysis: Traders use statistical tools to identify deviations of asset prices from their historical averages. This analysis helps pinpoint potential mispricings, signaling opportunities to buy undervalued assets or sell overvalued ones.
🔹Pairs Trading: This strategy involves identifying related assets whose prices have diverged from their typical correlation. Traders simultaneously buy the relatively undervalued asset and sell the overvalued one, anticipating that their prices will converge back to their historical relationship.
🔹Volatility Trading: Mean reversion is also applied in trading volatility spikes. Traders anticipate that extreme volatility levels will normalize over time, leading them to enter positions to benefit from this reversion to the mean volatility.
🔹Algorithmic Trading: Algorithms are designed to detect deviations from historical averages in real-time. These algorithms automatically execute trades based on predefined parameters, aiming to profit from mean reversion patterns.
By employing these approaches, traders seek to capitalize on mean reversion tendencies in asset prices, utilizing statistical analysis, correlations between assets, volatility patterns, and automated strategies to identify opportunities for profitable trades in financial markets.

Calculating Mean Reversion
To calculate mean reversion metrics using statistical analysis, several steps involving the calculation of average price, deviations from the average, standard deviation of prices, and Z-scores are necessary.
Steps to Calculate Mean Reversion:
1. Collect Data:
Gather a time series dataset of prices for the asset you’re analyzing.
2. Calculate the Average Price:
Find the mean (average) price of the asset over a specific period. This is usually calculated by summing up all prices and dividing by the number of observations.

3. Compute Deviations from the Average:
Determine the difference between each individual price and the calculated average price. This shows how much each price deviates from the mean.

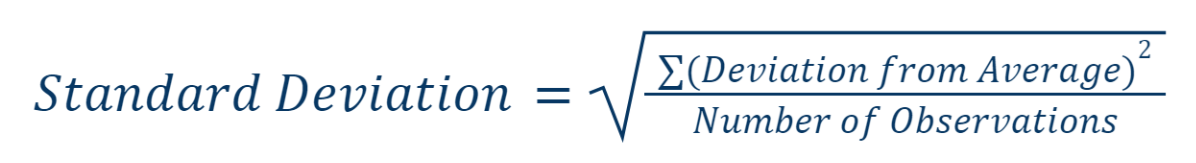
4. Calculate Standard Deviation of Prices:
Find the standard deviation of the prices. This measures the amount of variation or dispersion of prices around the mean.
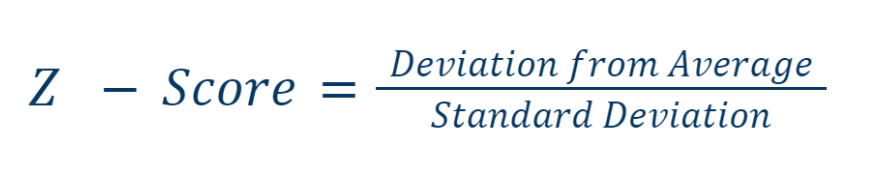
5. Compute Z-Scores:
Z-scores indicate how many standard deviations a data point is from the mean. It’s calculated by dividing the deviation from the mean by the standard deviation.
6. Analyze Mean Reversion:
- Positive Z-Score (> 1): Indicates prices are above the mean by more than one standard deviation, suggesting a potential reversion towards the mean (possible sell signal).
- Negative Z-Score (< -1): Implies prices are below the mean by more than one standard deviation, suggesting a potential upward movement (possible buy signal).
- Z-Score near 0: Prices are close to the mean and might not indicate a significant deviation.
Mean Reversion Indicators and Trading Systems
1. Moving Averages:
Moving averages are a fundamental tool used in mean reversion strategies. They smooth out price data over a specified period, creating a trend-following line. Traders often look for situations where the current price deviates significantly from the moving average, indicating a potential mean reversion opportunity.
2. Relative Strength Index (RSI):
The RSI measures the magnitude of recent price changes to evaluate overbought or oversold conditions. A high RSI value (typically above 70) suggests the asset may be overbought and due for a pullback, while a low RSI (below 30) may indicate oversold conditions, potentially signaling an upcoming upward correction.
3. Moving Average Convergence Divergence (MACD):
MACD is a trend-following momentum indicator that consists of two moving averages: the MACD line and the signal line. Crossovers between these lines and divergences from price movements are used to identify potential shifts in momentum and potential mean reversion opportunities.
4. Bollinger Bands:
Bollinger Bands consist of a moving average line accompanied by an upper and lower band, typically two standard deviations away from the average. These bands widen and narrow based on market volatility. When prices move outside the bands, it might signal overbought or oversold conditions, suggesting a potential mean reversion to the mean.
Mean Reversion Trading Systems:
- Combining Indicators: Traders often use a combination of these indicators to confirm signals. For instance, they might look for an asset that is trading significantly above or below its moving average while the RSI is in an extreme overbought or oversold state.
- Entry and Exit Strategies: Mean reversion trading systems typically involve setting specific entry and exit points based on these indicators. For example, entering a trade when the price is far from the moving average and RSI is above 70 for a sell position, and vice versa for a buy position.
- Risk Management: Proper risk management techniques, such as setting stop-loss orders and determining position sizes based on volatility, are crucial in mean reversion strategies to mitigate potential losses.
These indicators and trading systems form the basis for mean reversion strategies, allowing traders to identify potential turning points in the market and capitalize on price movements as assets revert to their mean values.

Applying Mean Reversion to Different Trading Styles
Day Trading Mean Reversion
Day trading based on the concept of “mean reversion” involves a strategy where traders seek temporary price extremes to enter trades during the day. This strategy is based on the assumption that the price of an asset tends to revert to its mean value after temporary deviations.
Indicators and Tools
1. Moving Averages:
- Simple Moving Averages (SMA): Represents the average price over a specific period.
- Exponential Moving Averages (EMA): Gives more weight to recent prices.
2. Relative Strength Index (RSI):
- Relative Strength Index helps determine overbought or oversold conditions based on price changes over a specific period. RSI values near 70 might indicate overbought conditions, while values around 30 might indicate oversold conditions.
3. Stochastic:
- Stochastic helps assess a security’s closing price relative to its price range over a specific period. Values above 80 typically suggest overbought conditions, while values below 20 suggest oversold conditions.
Algorithmic Strategies
Example Strategy:
🔹Identifying Overbought or Oversold Conditions: Use RSI and stochastic to identify moments when the asset’s price reaches extreme values.
🔹Confirmation using Moving Averages: Check if the asset’s price is significantly distant from its moving average. Significant divergence from the mean can confirm price extremities.
🔹Entry Points: When RSI and stochastic indicate overbought or oversold conditions, and the price is far from the moving average, this might serve as a signal to enter a trade.
🔹Setting Stop-Loss and Targets: Set stop-loss and profit target levels to manage risks and protect gains.
Implementing these indicators and strategies can help day traders identify potential trade opportunities based on mean reversion principles, aiming to capitalize on short-term price movements.
Swing Trading Mean Reversion
Let’s consider a stock, XYZ Inc., which typically trades around $50 per share. However, due to unexpected market events, the price of XYZ Inc. stock has suddenly dropped to $35, significantly below its historical average.
Applying mean reversion theory and analysis tools:
🔹Moving Averages: Observing the current price of $35 significantly deviating from the historical average of $50, the short-term moving average crosses above the long-term moving average, indicating a potential buying signal.
🔹RSI (Relative Strength Index): RSI suggests the stock is in an oversold condition with an RSI below 30, indicating a potential return to the mean.
🔹MACD (Moving Average Convergence Divergence): The MACD line crosses above the signal line, signaling a possible shift in the stock’s direction.
🔹Fibonacci Levels: Utilizing Fibonacci retracement levels, the stock price approaches a 50% retracement level, indicating a potential reversal towards the mean.
🔹Candlestick Patterns: Analyzing candlestick patterns, a hammer pattern forms, suggesting a potential price reversal.
Based on these indications from mean reversion theory and analysis tools, a decision is made to buy XYZ Inc. stock at $35, anticipating a return to its historical average of $50. The strategy is to capitalize on the expected movement of the stock price back toward its mean value.
Forex Trading Mean Reversion
Forex traders use historical exchange rates to spot potential reversals in currency pairs. They rely on indicators like moving averages, pivot points, and currency correlations to identify deviations from average values. By analyzing deviations and correlations, traders pinpoint potential mean reversion opportunities, helping them decide on entry or exit points in anticipation of the exchange rate returning to its historical mean. For instance, if EUR/USD falls to 1.1500 from an average of 1.2000, significantly below its historical mean, traders might see it as a signal to buy, anticipating a reversion to the mean.
Mean Reversion Pros and Cons
Benefits of Mean Reversion
The benefits of mean reversion strategies are multifaceted:
Structured Approach: Mean reversion provides a systematic framework for identifying potential trades based on deviations from historical averages, offering a structured method for traders to make informed decisions.
Versatility: This strategy exhibits versatility across various assets and timeframes. It can be applied to different markets, such as stocks, currencies, or commodities, as well as different time periods, allowing traders flexibility in their approach.
Effective Risk Management: Mean reversion strategies often come with well-defined entry and exit levels, enabling effective risk management. Traders can establish clear stop-loss orders or profit targets based on deviations from the mean, aiding in risk mitigation.
Profit Potential in Range Bound Markets: Mean reversion strategies can be particularly lucrative in range bound or sideways markets. Traders capitalize on the price oscillations around the mean, aiming to profit from these predictable movements.
In essence, mean reversion strategies offer a structured, versatile, and risk-managed approach to trading, allowing traders to capitalize on predictable price movements around historical averages, particularly beneficial in range bound market conditions.
Limitations of Mean Reversion
- Market Condition Sensitivity: Mean reversion strategies struggle in strongly trending markets.
- Increased Costs: Frequent trading leads to higher transaction costs, impacting overall profitability.
- False Signals: Susceptibility to false signals from market noise can result in erroneous trades.
- Impact of News Events: Mean reversion strategies may not account for sudden market movements caused by unexpected news.
- Lack of Directional Bias: These strategies do not predict market direction, which can be limiting in trend-heavy markets.
Building a Mean Reversion Strategy
Developing a mean reversion strategy involves several key steps:
Hypothesize: Clearly state a hypothesis to test. For mean reversion, this could involve assuming that an asset’s price will tend to revert to its historical mean or average after deviating from it.
Test Rules: Establish specific trading rules based on the hypothesis. These rules might involve indicators, thresholds, or other criteria that signal when to buy or sell an asset based on its deviation from the mean.
Optimize: Refine and optimize the trading rules. This step might involve backtesting the strategy using historical data to tweak parameters and improve its performance, such as adjusting the time frame for mean calculation or setting different entry/exit thresholds.
Demo Trade: Implement the strategy in a simulated or demo trading environment using out-of-sample data. This helps validate the strategy’s effectiveness in a real market scenario without risking actual capital.
Deployment: Once validated through demo trading, consider deploying the strategy with real capital, while continuously monitoring and adjusting it based on market conditions and performance.
Remember, mean reversion strategies, like any trading approach, carry risks and may not always perform as expected due to changing market conditions. It’s crucial to remain adaptable and continuously assess the strategy’s effectiveness.
Overview and Examples of Mean Reversion Strategies
Mean reversion strategies involve capitalizing on price movements returning to their historical averages. Effective strategies include:
- Bollinger Bands: Utilizes price movement outside the bands as potential buy/sell signals, expecting a return to the moving average.
- RSI (Relative Strength Index): Identifies oversold/overbought conditions for potential reversals back to the mean.
- Candlestick Patterns & Support/Resistance: Examines patterns (e.g., doji, hammer) near support/resistance levels as indications of potential reversals.
- Larry Connors’ Strategies: Connors RSI combines RSI and short-term mean reversion for identifying entry points.
- Price Action Strategies: Analyzes price patterns like double tops/bottoms or failed breakouts after deviations for mean reversion trades.
Example:
Using Bollinger Bands: If a stock price moves significantly above the upper band, a trader might consider selling short, anticipating a return to the moving average within the bands.
FAQs
Does mean reversion trading work?
Mean reversion trading can be effective, but it’s not foolproof. Market conditions, unexpected events, or prolonged trends can challenge its success. Rigorous testing and risk management are crucial for its viability.
In which markets does mean reversion trading perform well?
Mean reversion strategies can potentially work in various markets like stocks, currencies, commodities, and indices. However, their efficacy might vary based on market conditions and asset behaviors.
What is an example of mean reversion?
An example of mean reversion can be seen when a stock’s price deviates significantly from its historical average or moving average. If the price moves far above this average, the mean reversion theory suggests it will likely move back towards the average in the future.
What is the opposite of mean reversion?
The opposite of mean reversion is “momentum trading.” Instead of betting on a return to the mean, momentum trading involves buying assets that have shown an upward trend, expecting the trend to continue.
What does annuity to beneficiary with reversion mean?
An annuity to a beneficiary with reversion typically implies that upon the annuitant’s death, the surviving beneficiary will receive the same or a portion of the annuity payments previously received by the annuitant. This ensures continued payments to the beneficiary after the annuitant’s passing.